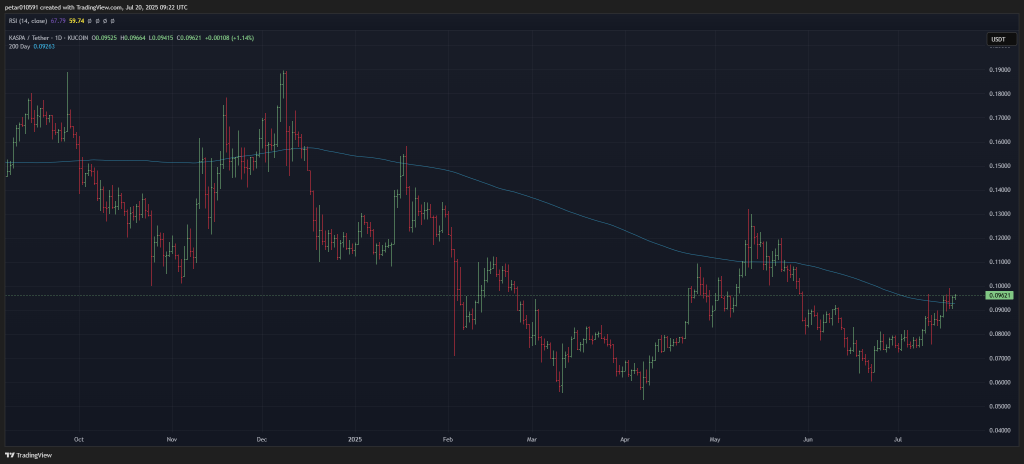
Kaspa is starting to look bullish again. The KAS price just pushed above the key $0.096 level and is now testing the 200-day moving average, which sits at $0.0926. That’s important since crossing this line often signals a trend reversal, especially after a long downtrend like the one we saw between March and June.
Over the past few weeks, Kaspa has been climbing steadily, forming higher lows. This shows growing buying pressure. The current daily candle is holding above the 200-day MA, which suggests that bulls are trying to flip it into support.
Let’s take a closer look at the indicators:
- ATR (14): 0.006
This measures volatility. A moderate ATR shows the price is moving with decent strength, but not in an overheated way. - Highs/Lows (14): 0.0069
This confirms that recent candles are pushing toward the higher end of their ranges, supporting the bullish momentum. - Ultimate Oscillator: 59.18
This is in bullish territory (above 50), meaning buying pressure is stronger than selling pressure across short, medium, and long timeframes. - Rate of Change (ROC): 24.46%
A 24% upward momentum shows strong price acceleration. Traders tend to view ROC over 20% as a bullish continuation signal. - Bull/Bear Power (13): 0.0127
This tells us bulls are currently stronger than bears. The positive value backs up the idea of upward pressure.
Read also: Crypto Veteran Shares Best Altcoins to Buy – Kaspa Makes the List!
Short-Term Kaspa Price Prediction
If Kaspa holds above the 200-day MA and turns it into support, we could see a short-term push toward $0.105–$0.11. That’s the next resistance zone, and it lines up with previous local highs.
But if it fails to stay above $0.0926, a pullback toward $0.089–$0.090 is possible, which would be the first support level.
For now, momentum is clearly favoring the bulls. If volume increases and Bitcoin stays stable, Kaspa could break out of its recent range and target $0.12 later this month.
Subscribe to our YouTube channel for daily crypto updates, market insights, and expert analysis.