Kaspa price continues to trade within a clear uptrend, but momentum has cooled slightly as it nears a familiar resistance zone. After several weeks of steady gains, the price is now testing the $0.089–$0.090 area, just under a major breakout level. Traders are watching closely to see whether this week will bring a continuation move toward $0.10 or another rejection back to support.
Let’s take a closer look at the technical setup to see what’s next.
What you'll learn 👉
📉 Kaspa Chart Overview
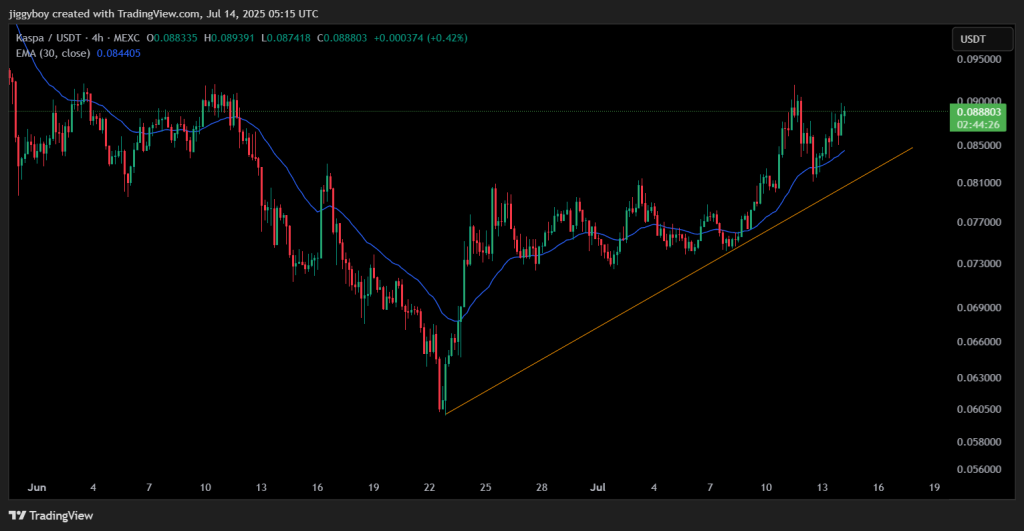
Kaspa 4H chart has been pretty clean lately. Since late June, the KAS price has been riding a rising trendline, consistently making higher lows. Every time it dips to around $0.084, it bounces, right where the trendline meets the 30 EMA.
Right now, KAS is sitting at about $0.0888. That resistance zone between $0.089 and $0.090 is still holding firm. It’s the same level that stopped the price earlier this month. If buyers can finally push through it, we could see a run toward $0.095, or maybe even that big $0.10 level everyone’s watching.
But if it gets rejected again, the KAS price could easily slide back to $0.084 or even $0.081. The whole setup looks like an ascending triangle, with flat resistance on top and rising support underneath. It’s a bullish pattern, but only if the bulls step up and make their move.
📊 Weekly Technical Indicators
Looking at the weekly indicators, there’s a mixed picture forming:
| Indicator | Value | Interpretation |
| RSI (14) | 48.022 | Neutral – momentum balanced |
| MACD (12,26) | -0.011 | Slight bearish pressure remains |
| ADX (14) | 21.849 | Early signs of trend strengthening |
| CCI (14) | 0.6178 | Neutral – no clear overbought/oversold |
| ROC (Rate of Change) | 14.857 | Price gaining – moderate bullish momentum |
| Bull/Bear Power (13) | 0.0032 | Slight bullish advantage |
Summary: Out of these six indicators, three lean bullish while the rest remain neutral or bearish. ROC, ADX, and Bull Power suggest buyers are gaining ground, but with MACD still negative and RSI stuck near 50, it’s not enough to shift the weekly trend just yet.
🧠 Kaspa Price Prediction (July 14 – 20)
🔴 Bearish Scenario:
A failure to hold $0.084 could trigger a deeper pullback toward $0.081 or even $0.077. This would break the current ascending structure and shift momentum in favor of sellers.
🟡 Realistic Scenario:
KAS price consolidates between $0.084 and $0.090 throughout the week. A few retests of resistance and trendline support are likely while the market waits for stronger cues from Bitcoin.
🟢 Bullish Scenario:
If Kaspa surges through $0.090 with heavy trading, then it will surge ahead to $0.095 or even $0.10. Such a move would confirm the ascending triangle pattern and put the bulls in control in the short term.
🧭 Wrapping Up
Kaspa price is trading in a defined uptrend with buyers defending dips consistently. But weekly indicators show some doubt remains. Breaking above $0.090 would confirm the bull, but inability to retain support of the trendline would reverse recent gains. Traders will be paying close attention to see if this week will bring a breakout or just more consolidation.
Read Also: GPT Predicts Whether Algorand Can Flip Stellar (XLM) in 2025
Subscribe to our YouTube channel for daily crypto updates, market insights, and expert analysis.