

Kaspa (KAS) price is still stuck in a tight range, it shows little momentum as it trades just below the 9-day moving average.
After weeks of sliding lower from its May high near $0.14, KAS hasn’t been able to mount a meaningful recovery. The price action looks tired, and unless something changes soon, sideways movement might stick around a while longer.
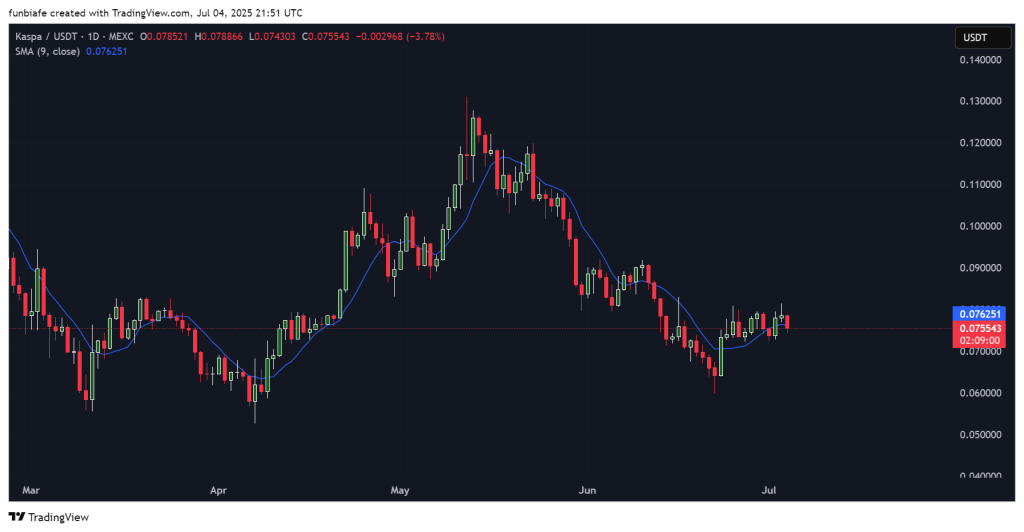
Right now, KAS price is trading at $0.07554, down about 3.78% in the last 24 hours. Let’s look at where things stand today.
What you'll learn 👉
📊 Kaspa Daily Snapshot (July 5)
- Current Price: $0.07554
- 24h Change: -3.78%
- 9-Day SMA: $0.07625
- Volume: Low and stable
KAS price is still trading just under the short-term moving average, and it keeps getting rejected at that level. Price candles are small and indecisive, which suggests that neither side is ready to take charge yet.
🔍 What the KAS Chart Says
The overall Kaspa structure still favors the bears. We’ve been seeing lower highs ever since the May peak, and there’s been no real reversal.
The market has moved into a consolidation phase since mid-June, as it bounces between $0.070 and $0.080.
There’s been some buying interest near the bottom of that range, but not enough to break above resistance. Until KAS can flip $0.080 into support, the trend stays weak.
The 9-day SMA is acting like a ceiling right now, and the longer the price stays under it, the more likely the sellers stay in control.
Read Also: Here’s the Kaspa Price If KAS Reaches Top 5 Status
📈 What the Indicators Are Saying
| Indicator | Value | What It Means |
| MACD (12,26) | -0.003 | Still showing bearish momentum |
| ADX (14) | 24.748 | Weak trend, leaning bearish |
| CCI (14) | 49.605 | Neutral – no strong signals |
| Ultimate Oscillator | 53.054 | Slight bullish pressure building |
| ROC | 10.328 | Showing some positive momentum |
| Bull/Bear Power | 0.0012 | Slight bullish edge, but nothing major |
Summary: Momentum looks like it might turn bullish, but the broader trend hasn’t flipped yet. The signals are split, which fits with the sideways price action we’re seeing.
🔮 What Could Happen Next
Bullish Scenario:
A clean breakout above $0.080, backed by volume, could cause a move toward $0.090. That would be the first solid step toward recovery.
Neutral Scenario:
KAS might just keep bouncing between $0.070 and $0.080 for now, with no clear direction until a new catalyst appears.
Bearish Scenario:
A slip below $0.070 could send Kaspa price down to the $0.063 zone, where support held last month.
🧠 Final Thoughts
Kaspa isn’t showing much strength yet, but it’s not breaking down either. It’s sitting in no man’s land, trapped between resistance and support, with mixed signals from the indicators.
Unless KAS price can break above $0.080 or below $0.070, expect more of the same: slow movement and low volume while traders wait for a clear signal.
Subscribe to our YouTube channel for daily crypto updates, market insights, and expert analysis.


