The crypto market is on the move again, jumping 2.44% and pushing total market cap to a massive $3.9 trillion. Trading volume also surged by nearly 32%, showing that investor interest is picking up fast.
A big reason for the spike? Bitcoin price just hit a brand-new all-time high of $110,000, while Ethereum followed with a strong 6% gain, now trading at around $2,593.40. With both of the top cryptocurrencies testing key levels, the charts and the fundamentals are backing up this bullish momentum.
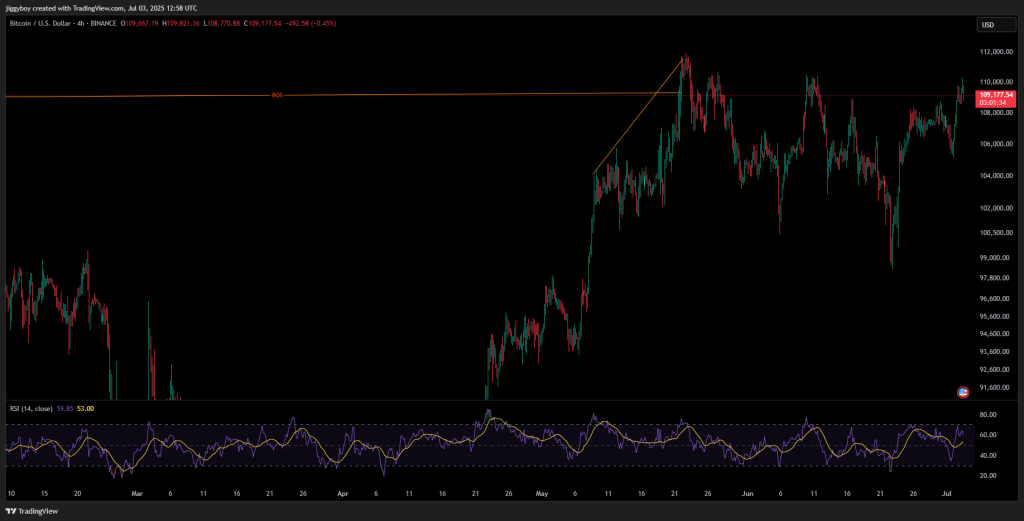
Bitcoin just pushed up nearly 2%, hitting a fresh all-time high of $110,000, and it’s not just noise. This move has been building for weeks. After that massive run from $95K to nearly $112K, BTC price spent a good chunk of time chopping sideways between $102K and $110K.
That long stretch of consolidation let the market cool off and gather strength. Now it’s finally broken out, and the momentum looks real. The RSI is sitting just below 60, so there’s still room for the price to climb without being overbought.
Top analyst Crypto Patel pointed out that this Bitcoin price rally feels different. It’s quieter, less retail-driven, and more about institutions. In one of his tweets, he explained how big ETFs like BlackRock’s are doing just a handful of trades each week but moving thousands of BTC. That’s a major shift from the usual noise and volatility of retail-driven pumps.
#Bitcoin is booming quietly — here’s why that matters.$BTC is now over $110K, but active addresses are still stuck near 2022 levels. Why?
— Crypto Patel (@CryptoPatel) July 3, 2025
Because most buying now happens through ETFs. BlackRock’s ETF makes just 24 weekly transactions, yet moves 6,400+ BTC.
This is Bitcoin 2.0… pic.twitter.com/9Y3ljXetQa
At the same time, macro conditions are helping fuel the fire. The U.S. M2 money supply just hit a record $21.94 trillion, and the dollar index (DXY) is down to 96.37, the lowest it’s been since early 2022.
Historically, these trends have lined up with Bitcoin breakouts. And with the S&P 500, Nasdaq, and tech stocks like NVIDIA hitting new highs, Bitcoin’s strong correlation with equities is once again in play.
Furthermore, Jump Crypto-linked wallets have added momentum after moving 7,499 BTC worth over $816 million. The wallet had remained inactive for two years before this sudden transaction, as reported by DustyBC Crypto. This move aligns with the broader narrative of whales and institutions re-entering the market as Bitcoin approaches price discovery zones.
💥BREAKING:
— DustyBC Crypto (@TheDustyBC) July 3, 2025
A wallet linked to Jump Crypto just moved 7,499 $BTC worth $816M after sitting dormant for 2 years.
Whale woke up swinging 🐳🔥 pic.twitter.com/wtITzc7Keh
Lower exchange reserves also support this trend. With only 14.5% of BTC supply now on exchanges, the lowest since 2018, selling pressure appears diminished. Analysts see these metrics as signals of accumulation phases, often preceding major rallies.
All signs point to a market that’s heating up, with Bitcoin leading the way.
Ethereum Price Approaches Breakout Point After Fibonacci Reversal
ETH price recovery has been backed by technical and on-chain activity. According to a tweet from Crypto Patel, Ethereum filled its fair value gap and bounced from the 0.618 Fibonacci retracement level around $2,118. It is now retesting an ascending channel’s resistance trendline, with a breakout potentially leading to the $2,877 to $3,000 range.
ETHEREUM breakout loading – $2,877 next?$ETH bounced from the 0.618 Fib and filled the FVG.
— Crypto Patel (@CryptoPatel) July 3, 2025
Now it's testing the resistance trendline — if it breaks, the next stop could be $3000
Are you in or waiting for confirmation?
Retweet + drop your target 👇 pic.twitter.com/5RrdzHZjix
Technical analysis of the 8-hour chart reveals a well-defined rising channel that has contained price action since May. ETH remains above the midline, with support forming around $2,500. If the breakout is confirmed, the next targets align with previous structural resistance points.
Moreover, on-chain data from BeInCrypto reports that over 36 million ETH is staked, a 3% increase during June. Whales are also moving large amounts of ETH off exchanges, over 200,000 ETH weekly, indicating long-term holding intentions despite stagnant daily active addresses.
🐋 Ethereum Whales Are Staking Big But Price Still Stalls
— BeInCrypto (@beincrypto) July 3, 2025
36M $ETH now staked (+3% in June) & whales are pulling 200K+ ETH off exchanges weekly. But daily active addresses have flatlined at 300K–400K.
📊 via @cryptoquant_com pic.twitter.com/Dqluc4rDQr
Crypto Total Market Cap Testing Key Resistance
The total crypto market cap is testing the $3.35–$3.37 trillion resistance zone formed by a descending trendline since mid-May. Technical analysis shows a bullish ascending triangle formation. Higher lows from the $3.02 trillion swing bottom to early July have pushed price action closer to a breakout point.
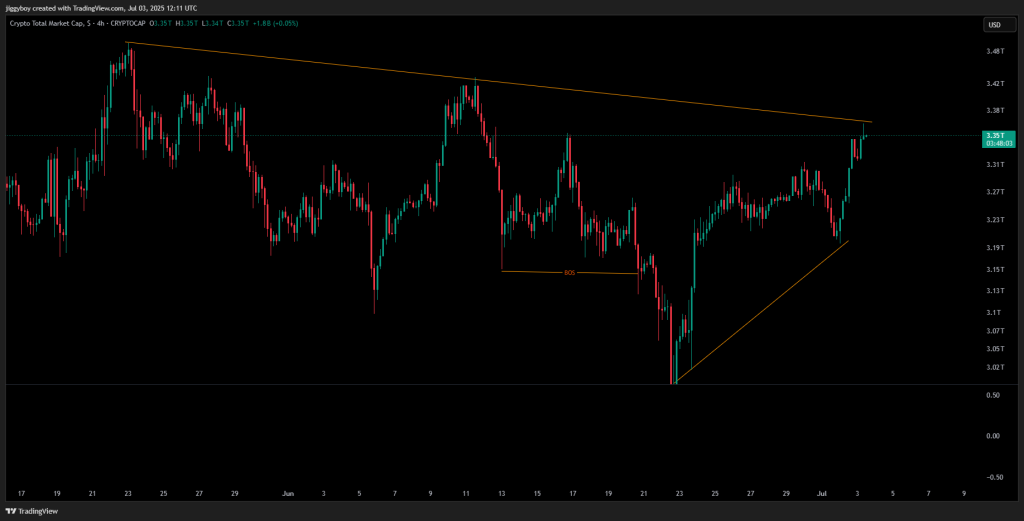
A previous break of structure around $3.22 trillion led to a rebound, and strong bullish candles suggest aggressive buying pressure. A confirmed breakout above the trendline could send the market toward $3.42 trillion and possibly $3.48 trillion, levels last seen in May.
If the market fails to break above, support lies at $3.19 trillion. A drop below this would put the $3.05 trillion level back into consideration, which would spoil the bullish configuration.
Technical charts, macro data, and institutional behavior in general indicate that the market is poised to make further gains should key resistance levels be breached in the next few days.
Read Also: XRP Momentum Builds as Analysts Drop Major Predictions
Subscribe to our YouTube channel for daily crypto updates, market insights, and expert analysis.