Algorand price has started to recover at the latter end of June, reversing from key support following weeks of bear pressure. While most altcoins have struggled to gain further traction, ALGO now takes the lead upwards, regaining its short-term moving average and closing in on a key resistance level.
So, what can we expect from the ALGO price in July?
What you'll learn 👉
How Did ALGO Price Perform in June?
Algorand started June trading above $0.19 but entered a sharp downtrend by mid-month. The selling pushed ALGO to the $0.157 point by June 22, where it finally bottomed and began reversing.
ALGO price then continued to steadily increase from there, closing the month just below the $0.19 level. Price behavior in June was largely a mix of sideways action and volatility with a clear change in momentum in the final week of the month.
The primary reversal was at the $0.155–$0.162 area of support, which began the bounce and held up ALGO in reclaiming its 50-period SMA.
Read Also: LINK Price Faces 3.8% Drop After Rejection – Is $12 Next for Chainlink?
Algorand Chart Analysis
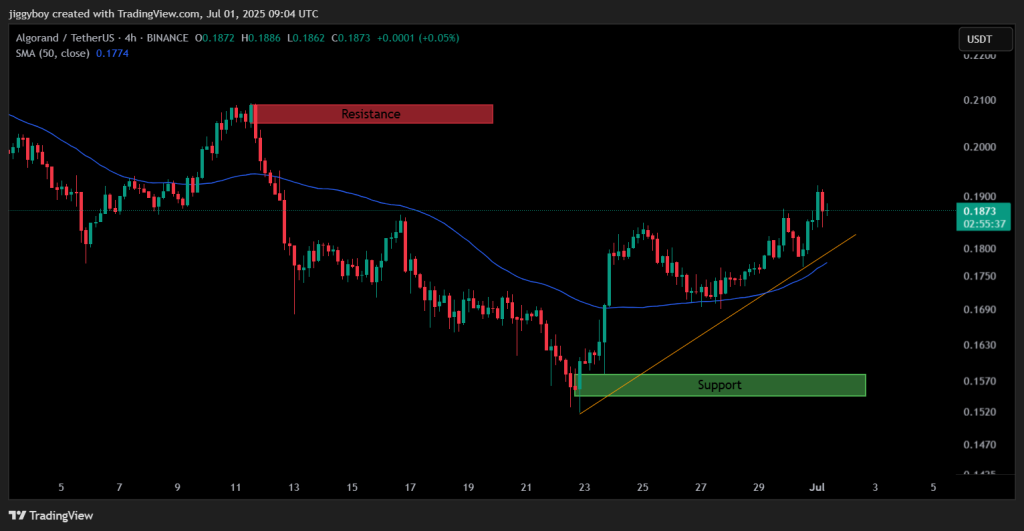
On observing the 4H chart, ALGO is forming an ascending channel with ever-increasing highs and higher lows post-June 23. The current uptrend is complemented by a clear breakout above the 50-SMA, currently acting as dynamic support around $0.1774.
At writing, Algorand is holding steady just under the $0.196–$0.202 resistance zone, the same area that shut down the rally back on June 10–12. If ALGO price can break through this level, it could open the door for a push toward $0.21 and higher.
On the flip side, the uptrend is still alive for now, with the rising trendline near $0.18 acting as support. But if that line gives out, we could see the price slide back toward the $0.162 zone.
Read Also: Robert Kiyosaki Predicts $1M Bitcoin – “I’ll Wish I Had Bought More”
Technical Indicators (Monthly Timeframe)
| Indicator | Value | Signal / Interpretation |
| ADX (14) | 31.697 | Strong trend strength, bullish alignment |
| CCI (14) | 25.6007 | Neutral – price slightly above average |
| Ultimate Oscillator | 48.777 | Slight bearish lean, fading momentum |
| ROC | 3.062 | Positive momentum, monthly gain |
| Bull/Bear Power (13) | 0.0027 | Mild buying pressure, bulls slightly lead |
Three out of five indicators lean bullish, with ADX and ROC confirming a trend is in place. However, the oscillator and CCI suggest momentum is still soft.
ALGO Price Forecast for July
Let’s break it down into two possible scenarios.
Bullish Scenario:
If ALGO breaks above $0.196 with volume, a move toward $0.21–$0.215 is likely. Holding above the trendline and 50-SMA supports this path. A bullish continuation may strengthen technicals across the board.
Bearish Scenario:
If ALGO can’t break through resistance, we might see the price slide back toward $0.177, or even dip to the $0.162 support zone. And if it loses the rising trendline, that would pretty much kill the current bullish setup and slow things down for a while.
Wrapping Up
Algorand price is showing some early strength, but it’s still in a tough spot. The real test is the $0.196–$0.202 area, that’s where the bulls need to step up. If momentum picks up, July could bring a continuation toward higher levels. If not, consolidation or a pullback is likely.
Are you watching ALGO this month? Let me know if you think it breaks resistance or turns lower.
Read Also: XRP & SOL ETF Optimism Grows, Bitcoin Hits Monthly ATH, and Major Crypto Arrests Made
Subscribe to our YouTube channel for daily crypto updates, market insights, and expert analysis.