Chainlink experienced a price rejection at a key resistance level this week, pressure was on its short-term momentum.
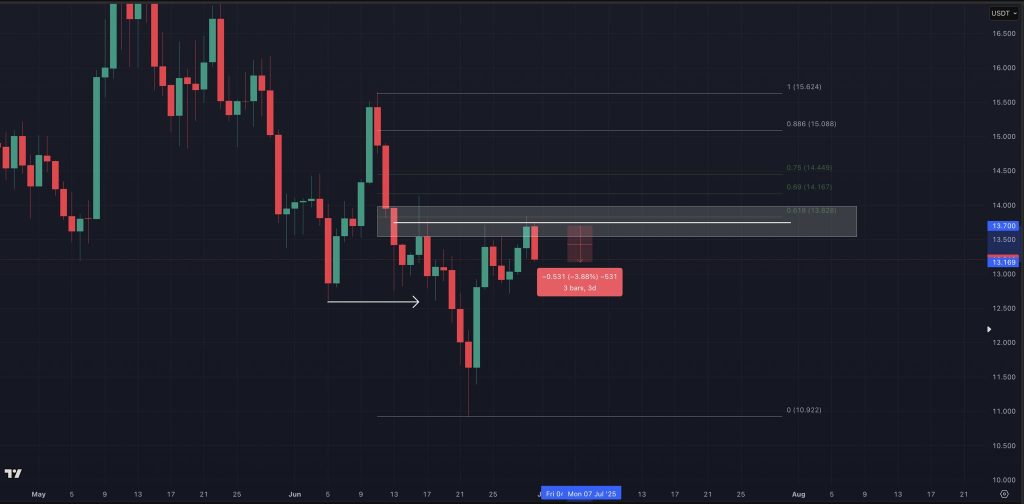
The LINK chart shared by market analysts shows the asset failing to close above the $13.82 mark, a zone defined by the 0.618 Fibonacci retracement level.
Crypto account CryptoChiefs posted a brief update on X (formerly Twitter), that described the move as a “+3% rejection,” and signaled the end of the recent upward push.
The rejection followed a modest rally from a local low at $10.92, where LINK price began a short-term recovery. This upward structure has so far failed to break above the resistance zone, now seen as the major obstacle to further gains.
What you'll learn 👉
Chainlink Price Analysis: Resistance Holding Firm Near 0.618 Fib Level
The Fibonacci retracement tool, applied from the $15.62 high to the $10.92 low, outlines the $13.828 level as the 0.618 zone.
This area is often viewed by traders as a potential turning point in price action. LINK price reached this level over the past few sessions but failed to close above it. A shaded gray zone between approximately $13.70 and $13.82 now acts as supply resistance.
The latest move up was met with selling pressure, leading to a drop of 3.88% over a three-day span. Unless price can reclaim and close above this level, the chart setup favors a continuation of the broader downward trend.
Support Levels and LINK Price Structure
Support for LINK sits just below current levels. Immediate short-term support appears around $13.16, while the $12.00–$12.50 range could provide additional downside buffers.

The long-term low of $10.92 remains intact and marks the base of the current range. LINK price action has developed into a corrective channel within a wider downtrend. As long as $13.82 holds as resistance, buyers may struggle to build momentum.
Read Also: Chainlink Holds $13 as Momentum Builds – Can LINK Price Hit $32?
Trend Direction and Market Setup
The price structure remains defined by lower highs and lower lows since mid-May. While the current recovery shows some strength, it lacks confirmation of a trend reversal.
The projected move indicated by technical arrows suggests a possible decline if rejection at resistance continues.
A daily close above $13.82 could shift sentiment and open the path toward higher retracement levels at $14.17 and $14.44. Until then, LINK price trades within a narrow range, testing the resolve of both buyers and sellers.
Subscribe to our YouTube channel for daily crypto updates, market insights, and expert analysis.


