Kaspa has had a tough price action over the past few weeks. Even though many altcoins tried to bounce back alongside Bitcoin’s push above $100K, KAS struggled to reclaim key resistance levels.
So, what can we expect from the Kaspa price in July?
What you'll learn 👉
How Did Kaspa Price Perform in June?
Kaspa started June around $0.096 but quickly entered a steep downtrend. By mid-June, it was already trading below $0.08, with little sign of momentum.
In total, KAS dropped nearly 20% throughout the month, spending most of the time ranging between $0.075 and $0.085.
This bearish action came despite the broader market holding steady, which makes Kaspa’s underperformance stand out even more.
Kaspa Chart Analysis
We had a look at the KAS/USDT chart, and it’s clear Kaspa is still struggling below the 200-day moving average – which currently sits at $0.096. The downtrend from early June continues to press downward, and even though there’s some sideways accumulation happening now, we’re not seeing any breakout confirmation.
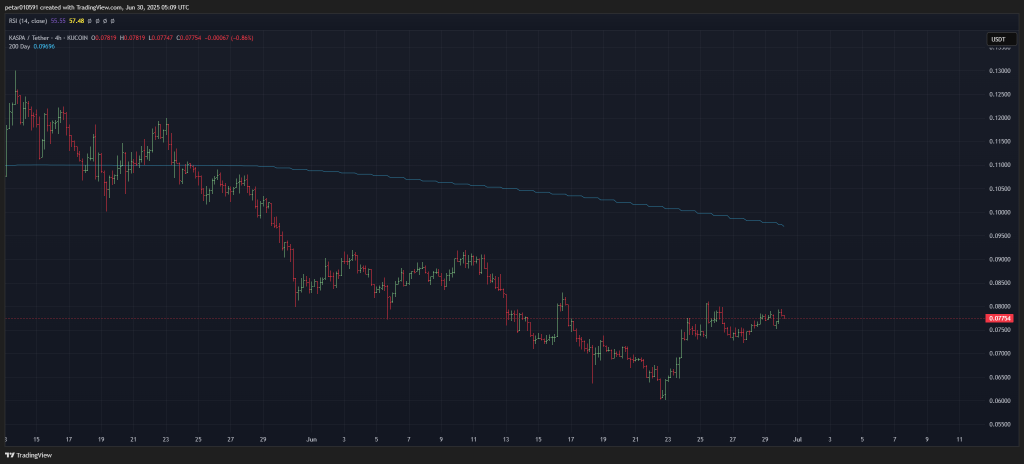
There were a few small bullish attempts around June 25–28, but all of them failed to push KAS above the $0.08–$0.081 zone. That’s clearly acting as a short-term resistance.
Support seems to be building in the $0.072–$0.074 area, but if we revisit those levels again, it could open the door to another leg down.
Technical Indicators (Monthly Timeframe)
| Indicator | Value | Signal / Interpretation |
|---|---|---|
| ADX(14) | 27.00 | Trend gaining strength, bearish bias |
| CCI(14) | 12.86 | Slightly bullish / neutral |
| Ultimate Oscillator | 41.92 | Mild bearish pressure |
| ROC | 1.96 | Low positive momentum |
| Bull/Bear Power(13) | -0.0008 | Weak bearish control |
From a technical standpoint, there’s no strong momentum in either direction – but the bias is slightly bearish. ADX shows that a trend is present, and since price action remains below the 200-day MA, it’s likely still a downtrend.
ROC (Rate of Change) is positive, which might suggest a very short-term relief rally, but other indicators aren’t backing that up yet.
Kaspa Price Forecast for July
Let’s break it down into two realistic scenarios.
Bearish Scenario:
If Bitcoin stays flat or dips, Kaspa is at risk of losing its $0.072–$0.074 support. If that cracks, we could see the price slide toward $0.065, or even revisit the May low around $0.06. With no strong demand showing on the charts and indicators leaning bearish, this feels like the higher probability setup.
Bullish Scenario:
If KAS somehow breaks above $0.081 and reclaims $0.085, that could flip short-term sentiment. In that case, we might see a move toward the 200-day MA at $0.096 – but it would take serious volume and market support. I’m not betting on that just yet.
Read also: Analyst Reveals Binance Real Reasons for Delaying Kaspa (KAS) Listing
Wrapping Up
For now, Kaspa looks range-bound and weak. Unless there’s a clear catalyst or strong altcoin recovery in July, I see more downside or sideways action ahead. If you’re long on Kaspa, this could be a wait-and-see month.
Let me know in the comments – are you still holding KAS, or waiting for a better entry? For now, it might be better to stay on the sidelines with this one.
Subscribe to our YouTube channel for daily crypto updates, market insights, and expert analysis.