

KAS price remains at a key resistance level following a steady recovery from recent lows. While momentum has improved slightly, the price action is testing a long-standing descending trendline, and technical indicators are mixed, with several showing early signs of strength.
After failing to break above the $0.080 zone on June 25, the token is now hovering just below that trendline resistance, currently trading near $0.0775.
Let’s take a closer look at today’s setup.
What you'll learn 👉
📅 What We Got Right Yesterday
In yesterday’s prediction, we highlighted the importance of a break above $0.078 to confirm a trend reversal. That move has not materialized.
As expected, Kaspa price remained stuck below the descending resistance line. We also noted that unless this barrier was cleared, consolidation between $0.071 and $0.075 was likely. The market respected this setup, trading within range and showing no breakout signs as of today’s open.
The bearish scenario, which outlined a drop below $0.071 leading to a test of $0.067, has so far been avoided, with support holding firm for now.
📊 Kaspa Daily Overview (June 29)
- Current Price: $0.07746
- 24h Change: +3.33%
- 4H ADX (14): 32.34
- Volume: Moderate but not expanding
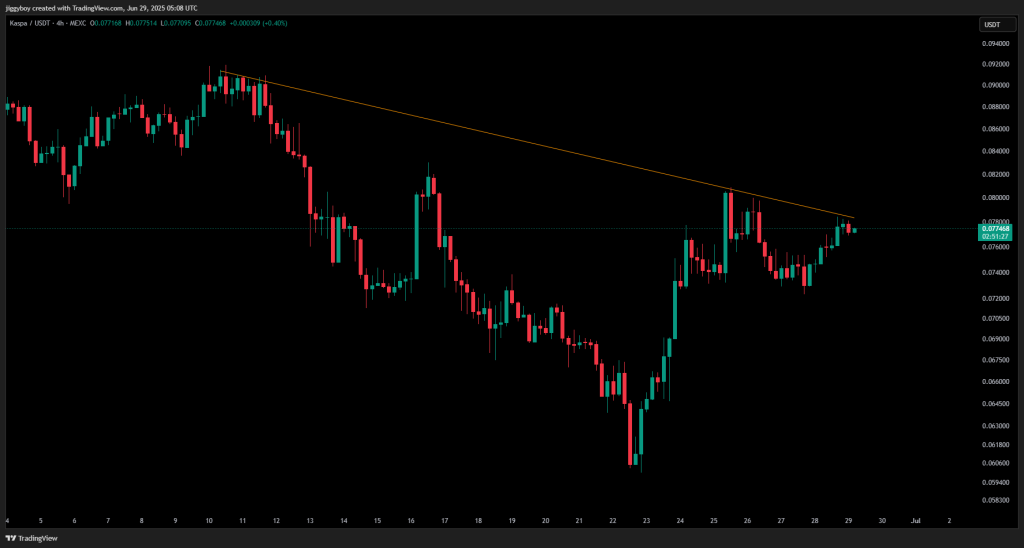
Kaspa price has recovered from its recent low at $0.064 and is now testing the descending trendline for the third time. Despite the upward move, momentum remains fragile. Volume is not yet showing strong follow-through, and price is pausing below key breakout levels.
🔍 What the Kaspa Price Chart Is Showing
The 4H chart shows a consistent downtrend that began above $0.09 earlier in June. Lower highs and lower lows confirm this structure, with the current move representing another test of resistance.
The descending trendline connecting June swing highs is still active. KAS Price has approached this level again but failed to close above $0.0785. Small-bodied candles and upper wicks suggest hesitation. This zone now represents a potential breakout or rejection point.
Failure to push higher may trigger a bearish reversal. However, a close above $0.080 with volume could confirm a trend shift.
📈 Technical Indicators (Hourly Timeframe)
| Indicator | Value | Signal / Interpretation |
| MACD (12,26) | -0.001 | Early bullish crossover forming |
| ADX (14) | 32.343 | Strong trend strength, supporting upside |
| CCI (14) | 16.0617 | Neutral, no directional bias |
| Ultimate Oscillator | 42.959 | Weak momentum, still below neutral |
| ROC | 1.823 | Positive price movement, bullish tilt |
| Bull/Bear Power (13) | 0.0008 | Bulls are slightly in control |
Summary: Momentum is gradually turning positive. ADX and MACD support trend continuation, while ROC and Bull Power indicate growing buying strength. However, Ultimate Oscillator suggests momentum is not yet fully restored.
🔮 Kaspa Price Prediction Scenarios
Bullish Scenario:
A breakout above $0.080 with heavy volume could lead to a rally to $0.084–$0.088. The trendline should reverse to serve as a support confirmation.
Neutral Scenario:
If KAS price holds between $0.074 and $0.078, sideways action may continue until a volume breakout occurs.
Bearish Scenario:
If price drops below $0.074, it would visit the support at $0.070 or even probe the bounce area at $0.064.
🧠 Wrapping Up
Kaspa price is trading near a key resistance line, with early indicators of strength but no confirmed breakout yet. Traders are watching the $0.080 level closely for a decisive move.
Until that level is cleared with volume, the chart remains neutral with a slight bullish bias. A failure to hold $0.074 could shift short-term sentiment back toward support zones.
As of today, the most likely outcome is further range-bound action between $0.074 and $0.078 unless bulls take control with a clean breakout.
Read Also: Pi Network Celebrates Pi2Day with Big News: Community Left Disappointed
Subscribe to our YouTube channel for daily crypto updates, market insights, and expert analysis.


