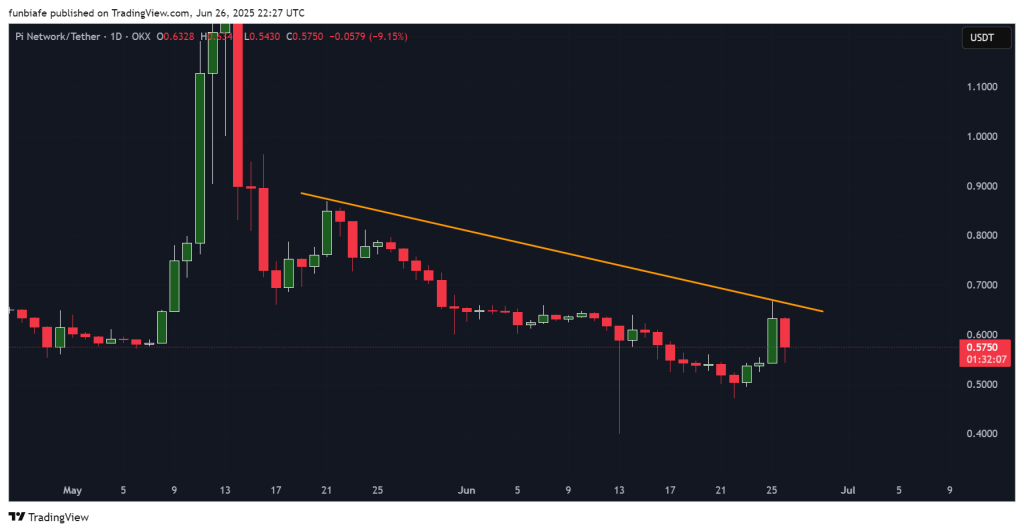
Pi Coin price failed to hold onto its recent rally after getting rejected at a key descending trendline. The price dropped over 9% in the latest session, then slid back to $0.5750.
That sharp pullback has shifted attention back to lower support zones, as momentum fades again and bearish pressure returns.
Let’s take a closer look at today’s setup.
What you'll learn 👉
📅 What We Got Right Yesterday
In yesterday’s prediction, we noted the importance of the $0.67 resistance zone and the need for strong volume to break above it.
We also noted that a failure to stay above $0.60 could trigger a move back toward the $0.50–$0.52 support range.
That’s exactly what played out. Pi Coin price pushed as high as $0.63 but was rejected sharply near the trendline and quickly dropped below $0.60.
Sellers stepped back in, and the price is now hovering closer to key support. We also mentioned that unless buyers took control, the structure would remain bearish. That view holds as the chart has flipped back in favor of the bears.
📊 Pi Coin Daily Overview (June 27)
- Current Price: $0.5750
- 24h Change: –9.15%
- Volume: Elevated during selloff
Pi Coin price is now trading just above short-term support after a strong rejection near $0.64. The token’s attempt to reverse the downtrend failed as price hit the descending trendline and sold off immediately. The failed breakout has put $0.50–$0.52 back in focus.
🔍 What the Pi Coin Chart Is Showing
The downtrend remains intact. Lower highs continue to form, and the descending resistance line has once again capped the rally.
The large red candle that followed the rejection shows sellers are still in control. The failed breakout attempt looks like a bull trap, where buying interest faded quickly.
Unless price reclaims $0.64 with strong volume, the chart still favors further downside. The $0.50–$0.52 zone is now the key area to watch. If that level breaks, Pi Coin could revisit the recent bottom around $0.47.
📈 Technical Indicators (Daily Timeframe)
| Indicator | Value | Signal / Interpretation |
| MACD (12,26) | –0.007 | Bearish crossover, momentum turning lower |
| RSI (14) | 45.75 | Neutral zone, no strong trend |
| CCI (14) | 145.47 | Bullish signal, reacting to short-term bounce |
| Ultimate Oscillator | 43.01 | Mild bearish sentiment |
| ROC (Rate of Change) | –0.827 | Weak downside momentum |
| Bull/Bear Power (13) | –0.0003 | Bears hold slight control |
Summary: Indicators are mixed. CCI shows short-term strength, but most others lean bearish. RSI remains neutral, confirming indecision.
🔮 Pi Coin Price Prediction Scenarios
Bullish Scenario:
A daily close above $0.67 with strong volume could trigger a rally toward $0.70. That setup hasn’t formed yet.
Neutral Scenario:
If price holds between $0.60 and $0.67, Pi Coin price may stay range-bound while waiting for stronger market signals.
Bearish Scenario:
If Pi slips below $0.60, look for a move toward the $0.50–$0.52 zone. A breakdown there could lead to $0.47 or lower.
Read Also: How Much Could 1,000 Pi Coins Be Worth by 2026?
🧠 Wrapping Up
Pi Coin price is once again struggling to gain traction after failing to break long-term resistance. The trendline rejection and bearish daily candle suggest sellers are back in control. Unless price reclaims $0.64–$0.67 on volume, the setup remains weak.
For now, all eyes are on the $0.50–$0.52 support zone. A breakdown there could mark the next leg lower, while a bounce might keep the token trapped in its current range.
Subscribe to our YouTube channel for daily crypto updates, market insights, and expert analysis.