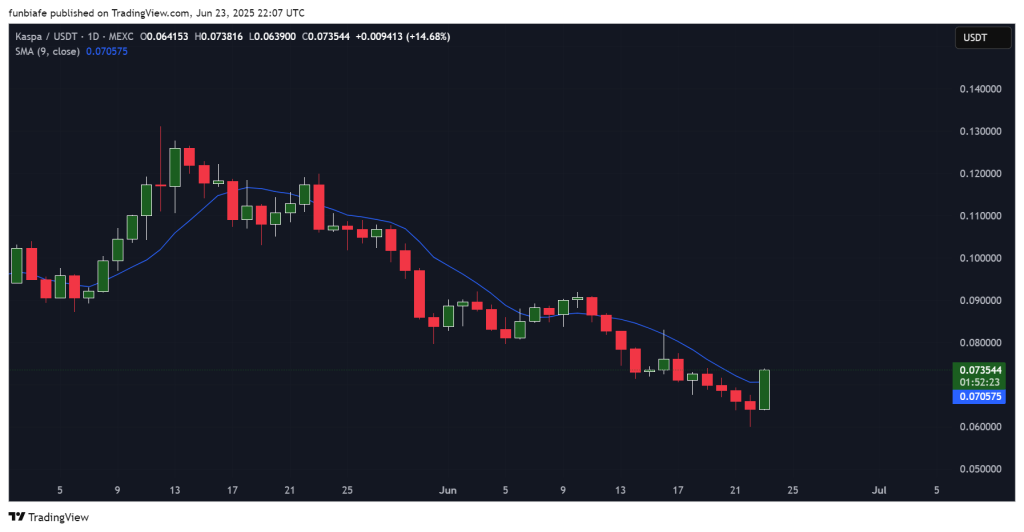
Kaspa is finally showing signs of life after weeks of sliding lower. The token just posted its biggest green candle in a while, closing above the 9-day moving average for the first time since early June.
That’s a good start, but the real question is whether this bounce has more room to run. KAS price is now trading around $0.0735 after bouncing from the $0.063 zone.
Buyers stepped in with force, by flipping the short-term momentum and pushing the price above a key trendline. While the move looks promising, traders are still waiting for confirmation that this isn’t just a one-day spike.
What you'll learn 👉
📊 KAS Daily Overview (June 24)
- Current Price: $0.0735
- 24h Change: +14.68%
- 9-day SMA: $0.0705
- Volume: Likely higher than average based on the size of the candle
The Kaspa chart is flashing green, but now it’s about what happens next. KAS price is sitting right under resistance at $0.075–$0.077, and breaking through that could unlock the next leg up.
Read Also: This Kaspa On-Chain Indicator Explodes as KAS Price Enters ‘Oversold’ Territory
🔍 What Kaspa Chart Is Telling Us
KAS price had been in a steady downtrend, the chart shows a pattern where each high and low is lower than the one before it. That pattern might finally be shifting.
If KAS manages to break above $0.077 and hold above it, the next area to watch is around $0.080 to $0.085.
But if it drops back under $0.070, there’s a good chance KAS could slip toward $0.063 or maybe even $0.060 again. How it closes today will tell us a lot about what’s coming next.
📈 Technical Indicators
| Indicator | Value | What It Means |
| ADX (14) | 50.33 | The trend is strong and right now it’s up |
| MACD (12,26) | 0.002 | Momentum is turning bullish, slowly but surely |
| CCI (14) | 202.44 | Overbought could mean a short pause or pullback |
| Ultimate Oscillator | 61.44 | Buying pressure is strong across all timeframes |
| ROC | 10.52 | Price has jumped fast in a short time |
| Bull/Bear Power | 0.0076 | Bulls have a slight edge over sellers |
Summary: Most of the indicators are pointing bullish right now, except the CCI, it’s saying the price might be getting a bit overheated in the short term.
🔮 What Could Happen Next?
Bullish Scenario:
If KAS pushes through $0.077 with volume, we could see it hit $0.080 or even $0.085 pretty quickly.
Neutral Scenario:
Kaspa price might chop between $0.070 and $0.075 as it cools off from the recent rally.
Bearish Scenario:
If buyers lose interest and the price falls below $0.070, KAS could slip back down to retest the $0.063 or even $0.060 level.
🧠 Final Thoughts
KAS price just put in one of its strongest days in a while. But the market wants to see a follow-through. Holding above $0.070 and breaking $0.075 would be a big step toward reversing the recent downtrend.
Right now, bulls have momentum but they’ll need to keep it going to turn this bounce into something more.
Subscribe to our YouTube channel for daily crypto updates, market insights, and expert analysis.