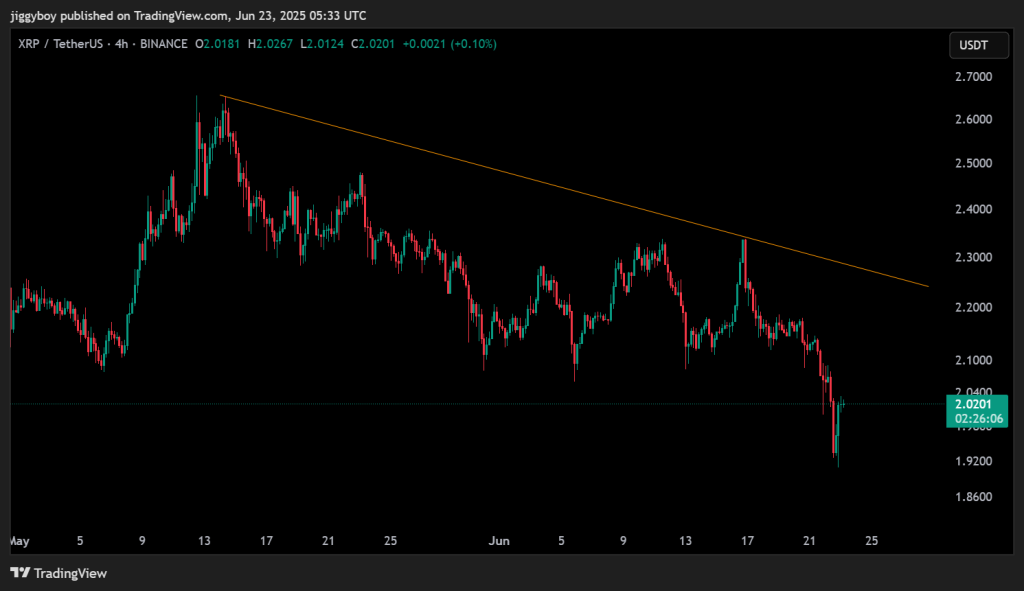
KAS price is attempting a minor rebound after falling to a multi-week low near $0.059. The token is trading around $0.065, but price remains stuck well below the descending trendline that has rejected every upside attempt since May.
Despite the bounce, no confirmed breakout has occurred. Price action remains within a broader bearish structure, and the recovery so far lacks strong volume support. The short-term movement may be corrective unless buyers manage to push above the $0.068–$0.070 resistance zone.
Let’s take a closer look at today’s setup.
What you'll learn 👉
📅 What We Got Right Yesterday
In the previous outlook, a close below $0.064 was flagged as a trigger for fresh selling. That move unfolded, with KAS price falling to the $0.059 level before recovering.
The bounce has brought the price back to the $0.065–$0.066 range, but it hasn’t broken any key resistance levels. As expected, no bullish breakout occurred above $0.070, and the neutral scenario failed to develop. KAS continues to trade near the lower band of its recent range.
With the momentum mixed and major resistance still in position, the market remains on tenterhooks. The downtrend is still characterized by the declining trendline.
📊 Kaspa Daily Overview (June 23)
- Current Price: $0.06519
- 24h Change: – 1.11%
- 4H RSI (14): 42.3
- 24h Volume: +67.69%
Kaspa price is trading just above local support, with price movement still trending downward in structure. The $0.060–$0.061 zone remains the nearest support. Multiple intraday tests have held so far, but a retest could weaken the area.
🔍 What the Kaspa Price Chart Is Showing
The 4H chart shows a clear downtrend defined by a descending trendline near $0.072–$0.074. Every recent rally has failed to break through this level. Price made a low near $0.059 before rebounding, but this bounce appears corrective.
The $0.068–$0.070 zone remains key resistance. If bulls fail to reclaim it, sellers may return with renewed strength. Price action remains weak overall, and candles are showing limited momentum or conviction.

📈 Technical Indicators (Hourly Timeframe)
| Indicator | Value | Signal / Interpretation |
| ADX (14) | 47.049 | Strong trend, current direction favors buyers |
| MACD (12,26) | 0 | Neutral/slightly bearish, no clear momentum shift |
| CCI (14) | 103.72 | Bullish momentum developing |
| Ultimate Oscillator | 57.81 | Buying pressure building |
| ROC | 7.991 | Positive momentum in short term |
| Bull/Bear Power (13) | 0.0027 | Bulls slightly stronger |
Summary: Most indicators show early bullish momentum, but MACD has not yet confirmed a trend shift. Momentum is fragile and unproven.
🔮 Kaspa Price Prediction Scenarios
Bullish Scenario:
A breakout above $0.070–$0.074 with strong volume could trigger a move toward $0.090. This has not occurred yet.
Neutral Scenario:
If $0.066–$0.068 holds, the KAS price could consolidate between $0.066 and $0.070 in the short term.
Bearish Scenario:
A daily close below $0.061 could trigger further downside, with support seen at $0.055 or even $0.050.
🧠 Wrapping Up
The Kaspa price is attempting to recover from recent prices but still below major resistance. Technical levels show short-term bullish momentum but price structure is still bearish.
Unless the $0.068 level is broken and held, selling pressure may return. A close below $0.061 would likely confirm a continuation of the downtrend toward deeper support zones.
Read Also: Crypto Market on Edge After U.S. Airstrikes on Iran – Ethereum and Altcoins Take the Hit
Subscribe to our YouTube channel for daily crypto updates, market insights, and expert analysis.


