Kaspa continues to slide lower after weeks of consistent selling pressure, and is currently trading at $0.06825. Price remains capped below a falling trendline that has been rejecting all upside attempts since late May.
With momentum indicators flashing red and volume fading, KAS price is hovering just above key support, and showing no signs of strength from buyers.
After failing to break the descending resistance near $0.080 earlier this month, KAS has drifted down toward the $0.068 zone.
Let’s take a closer look at today’s setup.
What you'll learn 👉
📅 What We Got Right Yesterday
In yesterday’s prediction, we flagged the $0.068 level as a key line to watch. We noted that a daily close below it could set up a deeper move toward $0.060 or lower.
That setup is now in progress. KAS price is trading just below $0.069, with no bullish signs emerging. The price continues to respect the downtrend and remains under pressure with no volume spike or reversal pattern.
We also mentioned that unless $0.070 held, sideways movement between $0.070 and $0.075 would break down. That range has now given way, and the market is leaning toward a full retest of the April consolidation levels.
📊 Kaspa Daily Overview (June 21)
- Current Price: $0.06849
- 24h Change: -1.86%
- 4H RSI (14): 38.8
- Volume: Low and declining
Kaspa price remains in a narrow trading range near support. The price structure is defined by lower highs and a gradual descent, it reflects strong control from sellers. The $0.066–$0.068 zone is acting as temporary support, but repeated tests may weaken it.
🔍 What the Kaspa Chart Is Showing
The Kaspa chart structure remains firmly bearish. Price has been unable to break above the descending trendline, which now sits near $0.078–$0.080.
Attempts to climb above this resistance in early June failed, and the market has been slowly grinding lower ever since.
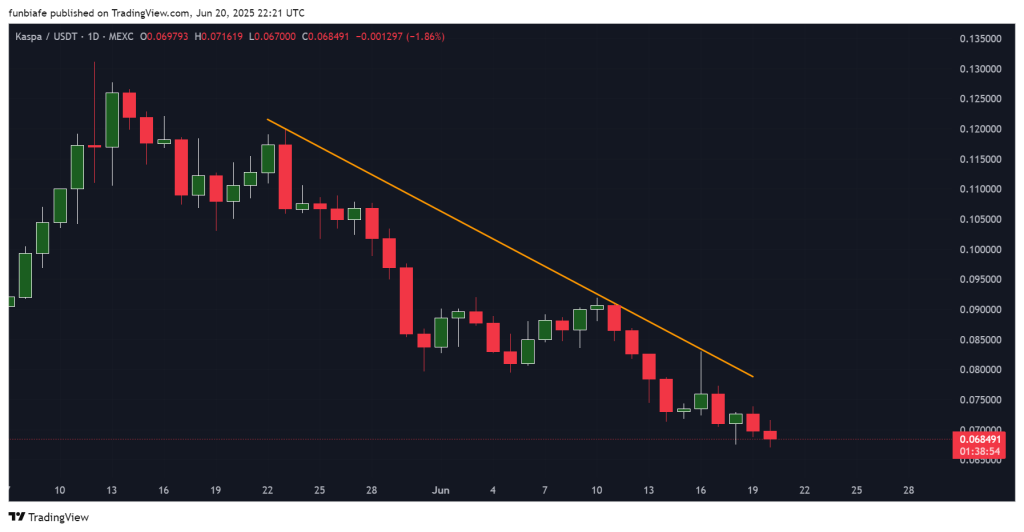
Candles are mostly small-bodied, with weak closes and fading momentum. No bullish divergence or breakout setup is visible. If $0.066 breaks, the next support zone sits between $0.063 and $0.060.
Read Also: Kaspa Holders Aren’t Selling – What This 6-Month Chart Shows
📈 Technical Indicators (Daily Timeframe)
| Indicator | Value | Signal / Interpretation |
| MACD (12,26) | -0.008 | Weak momentum, bearish crossover |
| ADX (14) | 32.968 | Strong downtrend, bears in control |
| CCI (14) | -109.156 | Oversold, continued selling pressure |
| Ultimate Oscillator | 38.8 | Selling pressure outweighs buying interest |
| ROC | -19.209 | Sharp downward momentum |
| Bull/Bear Power (13) | -0.0154 | Bearish control remains |
Summary: All indicators support the bearish trend. MACD and ROC show sustained downward momentum. ADX confirms trend strength. CCI and Ultimate Oscillator show that bulls remain inactive.
🔮 Kaspa Price Prediction Scenarios
Bullish Scenario:
A breakout above $0.077 with volume could open a path to $0.090. There is no sign of this forming.
Neutral Scenario:
If $0.070 manages to hold, KAS price may bounce between $0.070 and $0.075 in a narrow range.
Bearish Scenario:
A daily close below $0.068 could bring more selling, with downside targets at $0.060 or even $0.055 if momentum accelerates.
🧠 Wrapping Up
Kaspa price remains under strong selling pressure, with no bullish signals emerging. Price continues to respect the descending trendline and is now approaching key support again.
Unless a strong reversal appears, the most likely outcome for today is continued weakness near $0.068, with a possible breakdown to $0.060 if bears stay active.
Subscribe to our YouTube channel for daily crypto updates, market insights, and expert analysis.