Kaspa is trading at $0.06987 right now, but it’s been stuck in a downtrend. After multiple attempts to bounce back, it hits a wall and keeps going lower.
Price action still looks pretty weak, buyers just aren’t stepping in. The technicals aren’t helping either; momentum keeps drying up, and there’s no real sign of a turnaround yet. Sellers are still in control, while volatility remains low.
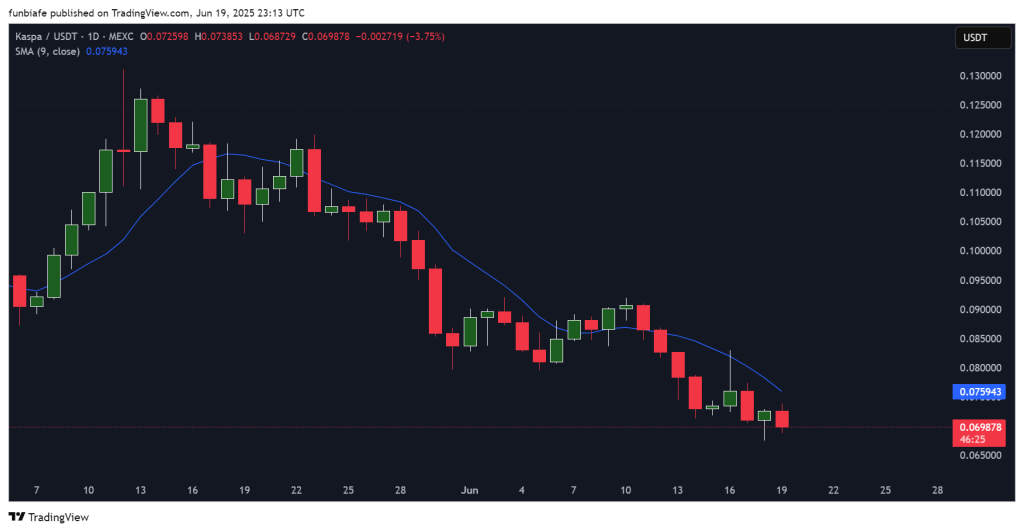
After falling from its peak above $0.13, KAS price has gradually moved lower, now trading just under $0.070. It remains capped below the 9-day simple moving average, with support being retested.
Let’s take a closer look at today’s setup.
What you'll learn 👉
📅 What We Got Right Yesterday
In yesterday’s prediction, we identified the $0.068–$0.070 range as key support and warned that a close below $0.068 could send the price toward $0.060 or even lower.
That scenario played out, with KAS dropping to $0.068729 before recovering slightly, by confirming that selling pressure continues to weigh on the market.
We also noted that a break above $0.077–$0.080 could flip short-term sentiment, but no signals supported that move yet. As of today, Kaspa price remains well below that zone with no momentum shift.
📊 Kaspa Daily Overview (June 20)
- Current Price: $0.069878
- 24h Change: -3.75%
- SMA (9): $0.075943
- Volume: Low
Kaspa has been trading in a narrow, declining channel. KAS price remains under the 9-day SMA, which continues to act as dynamic resistance. Short candles with long upper wicks point to failed breakout attempts and fading interest from buyers.
🔍 What the KAS Chart Is Showing
The Kaspa chart structure remains bearish. KAS continues to print lower highs and lower lows, consistent with a downtrend.
Every bounce has been met with selling, especially around the $0.075–$0.078 area. Current support around $0.068–$0.070 is under pressure again.
A confirmed breakdown could push KAS price to $0.065 or even $0.060. To turn things around, the price must reclaim the 9-day SMA and break above $0.077 with volume.
Read Also: Why Kaspa Whales Are Quietly Loading Up on KAS During the Dip
📈 Technical Indicators (Daily Timeframe)
| Indicator | Value | Signal / Interpretation |
| MACD (12,26) | 0.000 | No bullish momentum, flat signal |
| ADX (14) | 0.0008 | No trend strength, very low volatility |
| CCI (14) | -22.71 | Neutral, slightly bearish pressure |
| Ultimate Oscillator | 44.562 | Light bearish momentum |
| ROC (Rate of Change) | -1.108 | Negative momentum, bearish pressure |
| Bull/Bear Power (13) | -0.0003 | Bears remain slightly stronger |
Summary: Most indicators lean bearish. MACD, ROC, and Ultimate Oscillator suggest weak momentum. ADX confirms there’s no strong trend building, while the Bull/Bear Power reflects slight selling dominance.
🔮 Kaspa Price Prediction Scenarios
Bullish Scenario:
A move above $0.077 with strong volume could trigger a push toward $0.090. There’s no signal supporting this yet.
Neutral Scenario:
If $0.070 holds as support, KAS price may continue to move sideways between $0.070 and $0.075.
Bearish Scenario:
If KAS ends up closing below $0.068, there’s a good chance it could drop further, possibly to $0.060 or even $0.055 if selling picks up.
🧠 Wrapping Up
Kaspa price remains stuck below short-term resistance, with no strong buyers stepping in. Momentum is fading, and volatility is low.
As long as the price stays under the 9-day SMA, the path of least resistance appears to be lower. Traders are watching the $0.068 level closely to see if it holds or breaks.
Subscribe to our YouTube channel for daily crypto updates, market insights, and expert analysis.