SUI price is showing signs that it could be preparing for another bounce. The chart reveals a familiar setup where the price is once again approaching a key zone of support, one that has held firm multiple times in the past.
If we look at the daily timeframe, we can see that SUI has been respecting a trendline that has acted as a strong base since August 2024. Every time the price has tapped into this zone, it has staged a notable recovery. Now, SUI is back near that same trendline, and this might be the last great chance to accumulate before another leg higher.
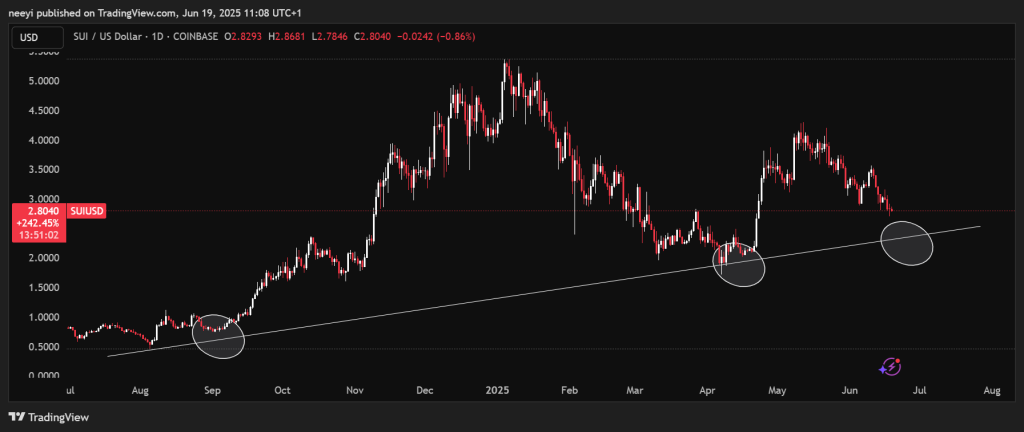
The current price of SUI is hovering around $2.81, and it is closing in on the rising support zone that has already triggered two strong bounces in recent months. These bounces are marked on the chart, showing clear rebounds from areas of demand.
If SUI can hold this level and build a base, it might be setting up for a new rally that could test previous highs or even break them.
What you'll learn 👉
MACD Suggests Bearish Momentum Is Fading
Looking at the MACD, we can see that while momentum has been bearish, the gap between the MACD line and the signal line is narrowing. This suggests that the selling pressure is slowing down. The histogram bars have been shrinking, which often signals an upcoming shift in momentum. If the MACD line crosses above the signal line, it could trigger a bullish reversal signal.
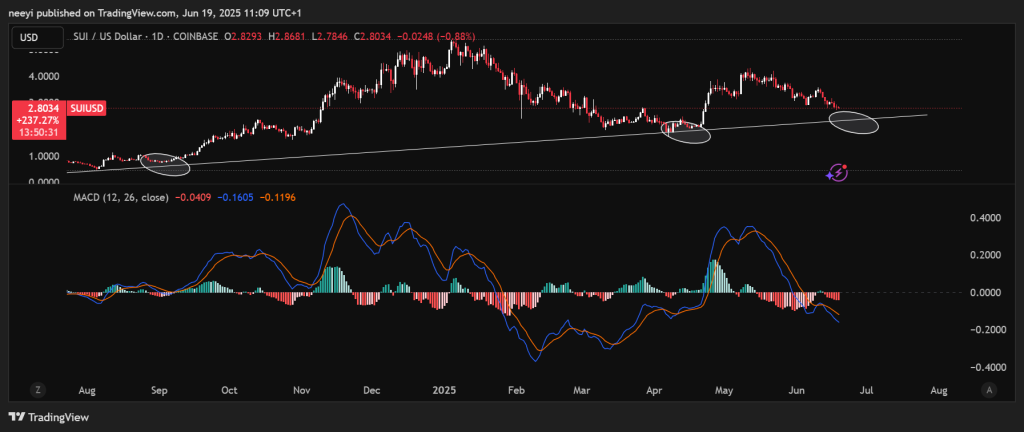
This kind of MACD behavior often precedes a breakout or a trend change, especially when the price is sitting on a key support level like it is now.
RSI Divergence Could Be the Bullish Trigger
Perhaps the most important signal is coming from the RSI. The current RSI value is around 35, which means SUI is close to being oversold. But beyond the number itself, there’s something even more meaningful here, a bullish divergence.
While the SUI price has been making lower lows, the RSI has been making higher lows. This is known as a bullish divergence and it’s often a leading indicator that the price may soon reverse to the upside. It shows that even though the price is falling, the strength behind the move is weakening. That’s a classic sign that the bears are running out of fuel.
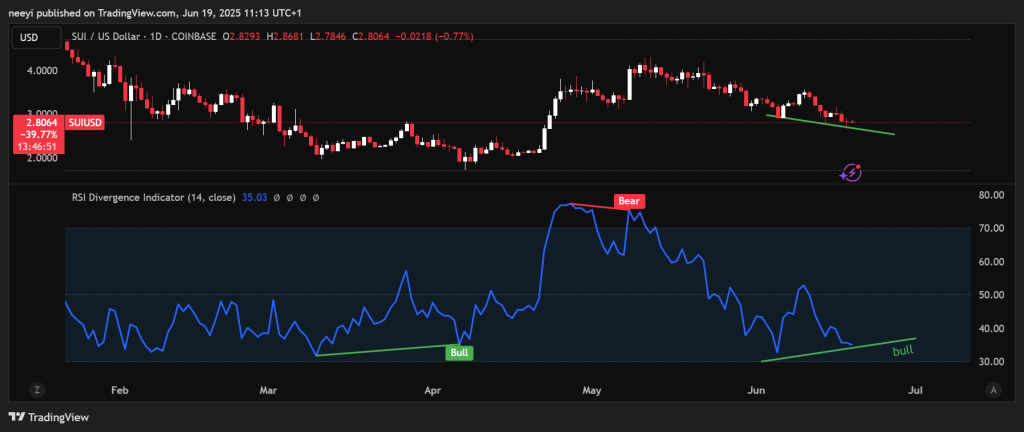
This divergence is visible on the chart and matches the last time SUI bounced strongly from this support zone. If history repeats, we might be at the early stages of another upward move.
Verdict: One Last Chance Before the Rally?
Putting all this together, SUI looks like it is at a make-or-break point. The price is resting on a major trendline support that has held since 2024. The MACD is starting to curve up, hinting at a momentum shift, and the RSI is flashing a bullish divergence.
Read Also: Has Bitcoin Price Topped Out? Chart Hints at Major Drop to This Key Level
If buyers step in here, this could be the last low before SUI makes a new move to the upside. On the other hand, if the price breaks this trendline decisively, it might signal more downside ahead.
But as things stand now, the indicators are leaning bullish. If you’ve been waiting to enter the SUI market, this might just be the moment you’ve been watching for.
Subscribe to our YouTube channel for daily crypto updates, market insights, and expert analysis.