This Hidden Litecoin (LTC) Price Pattern Could Be the Setup No One Saw Coming – Is a 40% Rally Ahead?
Litecoin is starting to catch some attention again. The LTC price just broke out of a key chart pattern and is now moving sideways, right above a strong support zone. With not much resistance showing up above current levels, traders are on alert for a possible bigger move.
However, a tweet from market watcher Pointman stirred things up further, suggesting a diamond reversal pattern might be forming, a setup that could point to a major trend shift.
Pointman hinted that the Litecoin price might be gearing up for a bullish breakout. While not everyone agrees it’s a textbook diamond pattern, there’s growing interest in LTC current setup. The price has already pushed through a falling wedge, often a bullish sign, and is now sitting in the $81–$84 range, an area that’s acted as solid support in the past.
Accumulation Zone Holds as Litecoin Price Breakout Structure Builds
The daily chart indicates that LTC price has completed a falling wedge pattern, typically seen as a reversal structure. Since the breakout, the currency has consolidated narrowly above its support level, with low volatility. This is a sign of accumulation as the traders are preparing for the next move.
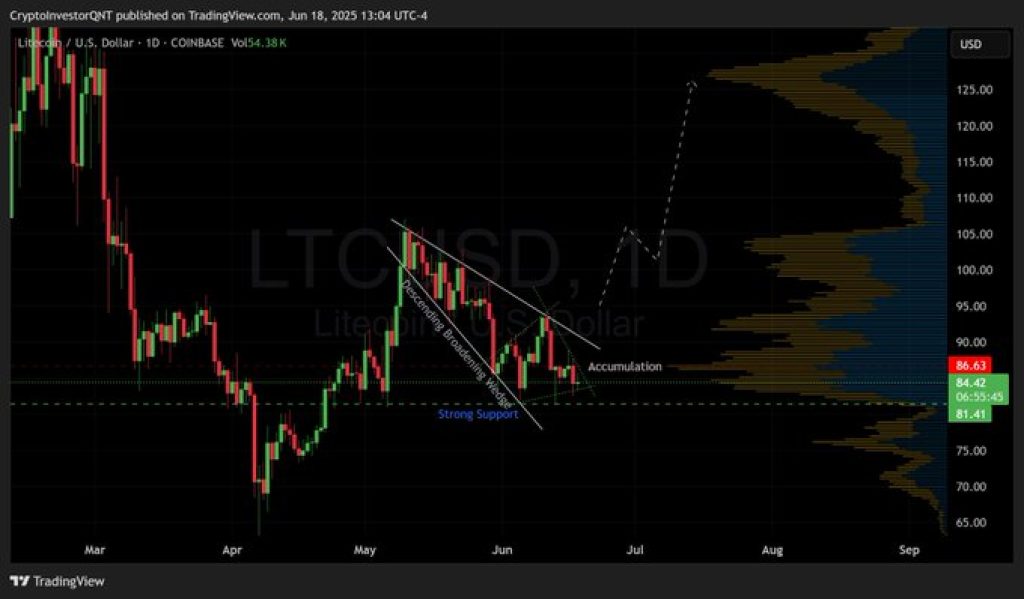
The current support zone between $81 and $84 has repeatedly served as a floor. Price is now facing resistance near $86, which could act as the next key barrier before higher levels open up. Should the price hold above support and break resistance with volume, the chart points toward further upside.
Volume Profile Suggests Limited Resistance Ahead For LTC Price
The volume profile reveals that a large portion of historical trading occurred between $80 and $95. Above this range, the LTC chart shows a thin volume zone extending toward $115 and $125. When volume gaps appear above price, it often allows for faster movement during breakouts.
This setup, paired with the existing consolidation range, creates a structure that may favor bulls if momentum builds. The LTC price projection shown on the chart outlines a potential move toward the $125 area, which would represent a 40% increase from current levels.
While some market participants debate the exact reversal pattern forming, there is agreement that LTC may be preparing for a larger directional move. Pointman’s tweet adds weight to this view, framing the current range as the potential base of a broader trend shift.
The traders will be keeping an eye on key resistance levels in the near term. If the Litecoin price blasts through the levels with volume, the technical and sentiment indicators will likely come together and set the stage for the next breakout.
Subscribe to our YouTube channel for daily crypto updates, market insights, and expert analysis.