
The price action on the Onyxcoin (XCN) chart is sending a clear message to traders: this may not be the right time to buy. Multiple technical indicators are pointing to weakness, and the overall structure suggests that the downtrend is still firmly in place.
One of the most important signals on the chart is the breakdown below a major support level at $0.01591. This price point had been a solid base for several weeks, but once it was broken, the tone shifted quickly. Onyxcoin is now trading at around $0.01329, which means the previous support has turned into resistance.
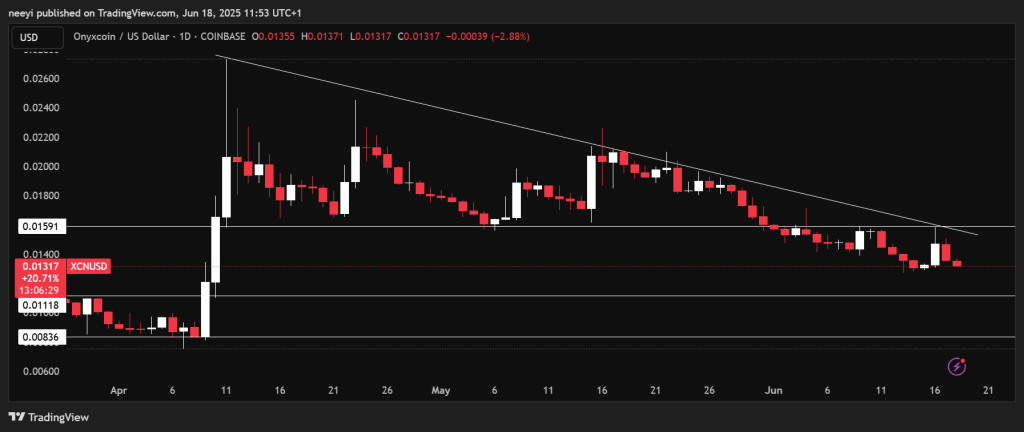
The price tried to bounce back but failed to reclaim that old support level. Instead, it got rejected on the way up, confirming that the bulls are struggling to gain control. When a level that once acted as support flips into resistance, it often signals that the market sentiment has changed for the worse.
What you'll learn 👉
RSI and MACD Indicate Weak Momentum
The momentum indicators are also showing weakness. The Relative Strength Index (RSI) is sitting at about 36.91, well below the neutral 50 line. It has stayed under 40 for some time now, which tells us that buyers are not stepping in with any real strength. An RSI in this zone suggests that the market is still under pressure and the risk of further losses remains high.
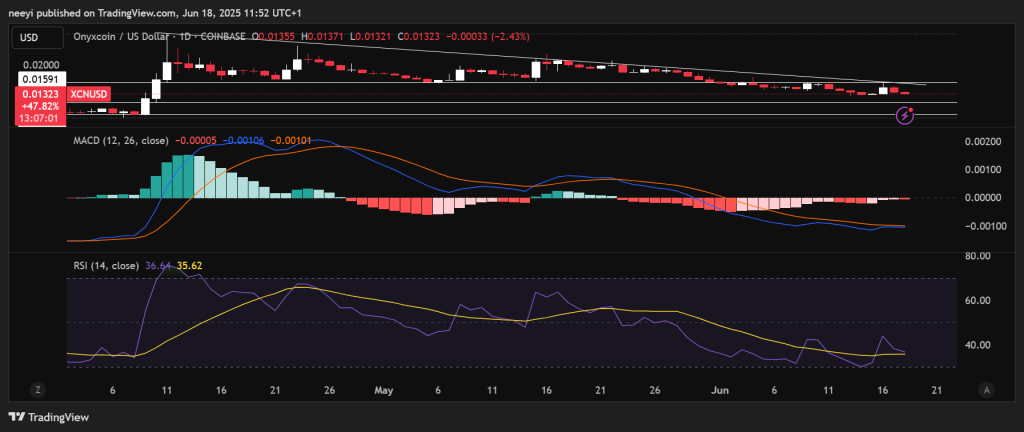
The MACD, another momentum tool, is also showing a bearish pattern. The MACD line is below the signal line, and both are sitting beneath the zero mark. There’s no crossover, no bullish momentum, and the histogram is flat in negative territory. This shows that the bears are still in control and there’s no real sign of reversal yet.
XCN Moving Averages Are Now Resistance
Looking at the bigger picture, the 50-day and 100-day simple moving averages are no longer providing support. The 50-day SMA is currently around $0.01693 and trending lower, while the 100-day SMA is even higher. With Onyxcoin’s current price at $0.01326, these averages are now well above it and acting as resistance.
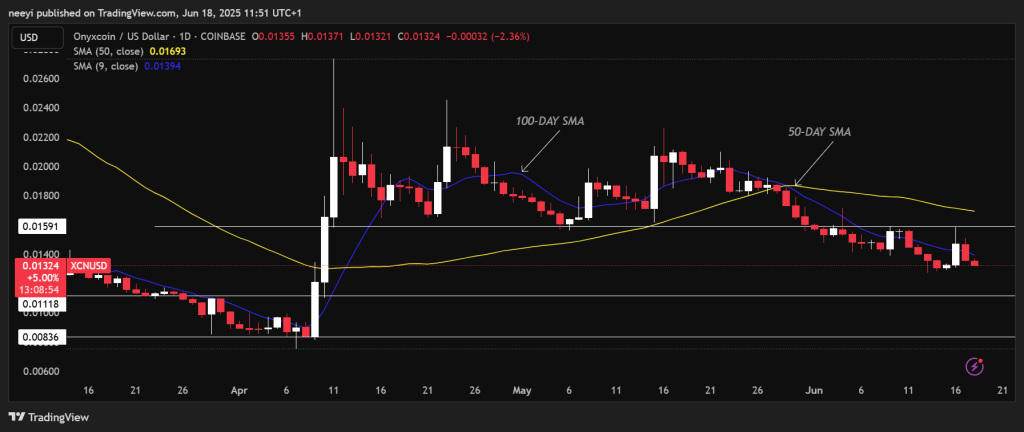
This means that even if the price starts to move higher, it will likely face heavy selling pressure near these moving average zones. Without strong momentum or buyer volume, breaking above those levels will be difficult. The fact that the price is trading under both the 50-day and 100-day SMAs confirms the bearish outlook in the short, mid, and long term.
Downtrend Pattern Remains Strong for XCN Price
Onyxcoin’s chart shows a clear pattern of lower highs and lower lows. This is a textbook signal of a downtrend. After briefly reclaiming $0.01591 earlier in June, the price quickly lost that level again and was rejected hard. That failed attempt further confirms that the bears are still in charge.
If this weakness continues, the next major support level to watch is at $0.01118. Below that is the yearly low around $0.00836. If selling pressure builds, there’s a strong chance these levels could be tested soon.
Rea Also: Missed Bitcoin Rally? Here’s the Game Plan Before BTC Price Hits $170K
The Onyxcoin chart is offering very little hope for bulls right now. The XCN price has broken below support, momentum indicators are weak, and moving averages are acting as resistance. Traders looking to buy may want to wait until the price structure improves and clear signs of a reversal appear. For now, the downtrend is still intact, and caution is the smart move.
Subscribe to our YouTube channel for daily crypto updates, market insights, and expert analysis.