Crypto Veteran Shares Bullish TRON (TRX) Price Targets for 2025 Based on Multi-Year Chart Setup

TRON price might be gearing up for a big move, if a recent tweet and chart from top analyst Crypto Patel are anything to go by. He shared a long-term chart showing that TRX has broken out of a multi-year consolidation phase, and so far, it’s holding up strong.
In his tweet, Patel asked, “$TRX MASSIVE BREAKOUT INCOMING?” He pointed out that TRX has stayed above its key support zone and is still looking bullish as long as it holds above $0.21.
He also reminded followers that TRX price pulled off a massive 6,469% rally during a past cycle, hinting that history could be setting up to repeat. The chart he posted, based on a 2-week timeframe, lays out the full picture of this setup.
What you'll learn 👉
TRON Long-Term Trendline Intact Since 2020
Looking at the TRX chart, you can see it’s been following a steady upward trendline since early 2020. That line has acted like a solid support zone for over five years now. Every time TRX has touched it, the price has bounced back and come out even stronger, forming higher lows and higher highs along the way. As long as TRX stays above that trendline, the overall uptrend still looks pretty healthy.
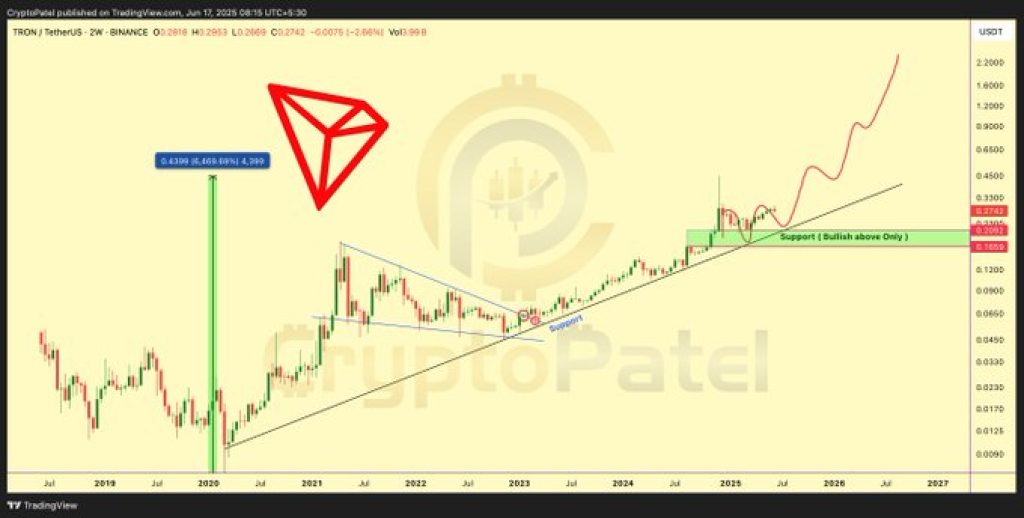
From around 2021 to 2023, the TRX price spent a lot of time moving sideways. It was stuck in a symmetrical triangle, just consolidating without any big moves. But in early 2024, it finally broke out of that pattern, and that breakout might’ve kicked off a new bullish phase.
Read Also: Shiba Inu Community, Here’s Why SHIB Price Will Never Reach $0.01
Support Zone Re-Test and TRON Price Structure
Following the breakout, TRX returned to re-test a horizontal support zone between approximately $0.10 and $0.125. The successful re-test of this zone confirmed it as a new floor, replacing the prior resistance. According to the chart, as long as TRX price holds above $0.21, the bullish setup remains valid.
At the time of analysis, TRX is trading just above this level. The price has been making higher lows and staying above the long-term trendline, which supports the chance of more upward movement.RetryClaude can make mistakes. Please double-check responses.
Historical Rally and TRON Price Projections
In 2020, TRX recorded a 6,469% rally from around $0.012 to approximately $0.90. This historical move has been used as a point of reference in the current chart. Crypto Patel’s projection shows a possible rally toward $2.00 or higher by late 2026, based on repeating patterns and market structure similarities.
A curved red path shown on the TRON chart outlines a speculative parabolic move. While no exact timeline is provided, the structure implies a multi-year growth phase with potential for exponential gains. The analysis hinges on market stability and TRX maintaining its current trend above support levels.
Moreover, the combination of a long-term ascending trendline, successful breakout from consolidation, and holding key support zones forms the basis of the bullish case for TRX. Crypto Patel’s tweet and chart reinforce this outlook, with clear criteria set for invalidation. If TRX price stays above $0.21, the projected setup remains active. The market will likely watch for confirmation in the form of higher highs and increased volume.
Read Also: Ripple Didn’t Dump XRP – They Bought the Future While No One Was Looking
Subscribe to our YouTube channel for daily crypto updates, market insights, and expert analysis.

We recommend eToro
Wide range of assets: cryptocurrencies alongside other investment products such as stocks and ETFs.
Copy trading: allows users to copy the trades of leading traders, for free.
User-friendly: eToro’s web-based platform and mobile app are user-friendly and easy to navigate.