Kaspa Price Prediction For This Week: Will Rising Long Positions Push KAS Toward a Reversal?

Kaspa has been under pressure for months, but the tide may be shifting. After weeks of lower highs and failed breakouts, KAS price is showing early signs of resilience. The token is up nearly 3% on the week and trading above $0.075, though volume is still light.
Speculative interest is growing, with traders taking long positions and funding rates staying positive. This behavior, paired with a technical bounce from a key support zone, is drawing new attention to the asset.
Social media activity has picked up as well. A post by Dr. Fer has stirred conversation by suggesting Qubic may support Kaspa mining, while Kaspa Daily reported a 6.5% rise in open interest, paired with bullish funding behavior. Despite lacking official confirmation, these tweets added to the sentiment around a possible shift in market direction.
$QUBIC will mine $KAS ? 🤣 That is something crazy. No other project doooooiiinnnngggg something crazy stuff like $QUBIC. Founder is the genius in crypto world. $0.01 is inevitable. Join $QUBIC, stack it, sit back and relax. It creates wealthy generation. pic.twitter.com/1tDmdCvvuT
— Dr. Fer (@fmanik7708) June 15, 2025
Let’s take a closer look at this week’s setup.
What you'll learn 👉
📊 Kaspa Weekly Overview
- Current Price: $0.07563
- 7D Change: +2.94%
- 4H RSI: 39.136
- Volume: Down ~25%
Kaspa (KAS) price remains inside a multi-month downtrend but is attempting to stabilize above a key demand zone. The price has bounced from the $0.07 region after testing it multiple times. Sellers still dominate the higher timeframes, but the latest candle is green, and speculative activity has increased.
🔍 What the Kaspa Chart Is Showing
The weekly chart shows a clear descending trendline stretching back to late 2023. Every rally attempt this year has failed beneath this resistance. The April–May move also topped out below the trendline and reversed sharply.
KAS price is trying to stay above the $0.072 level right now, which has already acted as a launchpad a couple of times in the past. If it slips below that again, the next big support zone sits between $0.055 and $0.060. On the flip side, if Kaspa manages to close above $0.080, that could give bulls a short-term edge and open the door for a push toward the $0.10 area.
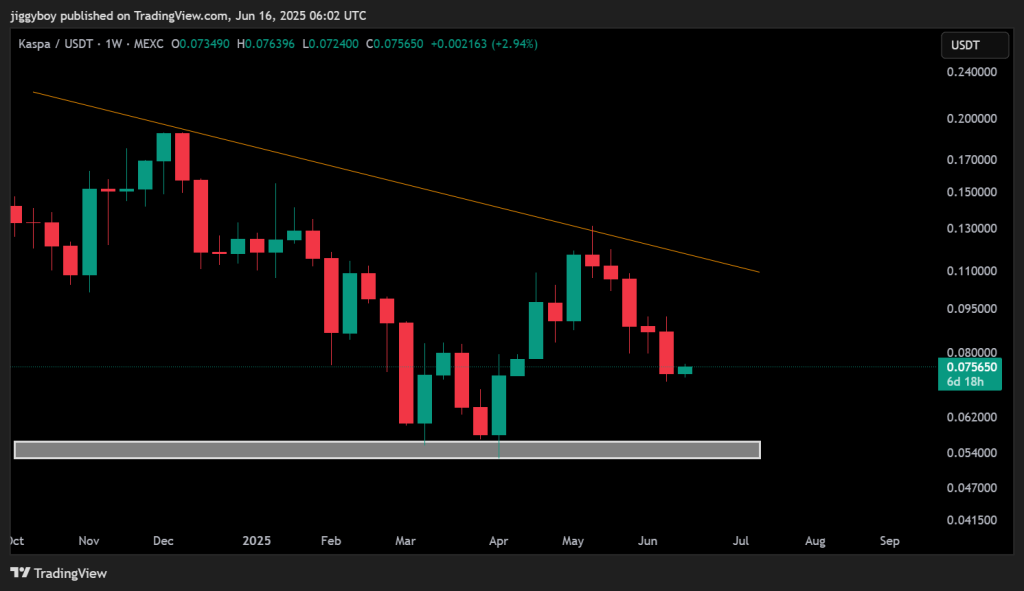
Lately, the candles have been small and quiet, showing a lot of hesitation from both buyers and sellers. The overall trend still leans bearish unless we see a strong breakout above the $0.085–$0.10 range with volume backing it up.
📈 Technical Indicators (Weekly Timeframe)
| Indicator | Value | Signal / Interpretation |
| MACD (12,26 | -0.011 | Bearish crossover, downtrend continues |
| ADX (14) | 31.755 | Strong trend supports current direction |
| CCI (14) | -58.748 | Mild bearish pressure |
| RSI (14) | 41.71 | Bearish zone, below midline |
| Ultimate Oscillator | 42.56 | Weak bullish effort, no confirmation |
| ROC | -6.027 | Price weakening over recent weeks |
| Bull/Bear Power (13) | -0.0321 | Bears remain in control |
Summary: The majority of technical indicators point to ongoing bearish conditions. ADX confirms a strong trend, while MACD and ROC show selling momentum continues. No strong reversal signal has been generated yet.
🔮 Kaspa Price Prediction Scenarios
Bullish Scenario:
If KAS breaks above $0.080 with volume, it could climb toward $0.10–$0.11 near the trendline. Open interest and funding data support this outcome, though confirmation is still needed.
Neutral Scenario:
Kaspa price may continue moving sideways between $0.072 and $0.080. Volume remains low, and traders are cautious near resistance.
Bearish Scenario:
A close below $0.072 could send KAS back toward the $0.060–$0.055 zone. Failure at this level would leave the March wick near $0.042 exposed.
🧠 Wrapping Up
Kaspa price is trying to hold onto a key support zone after months of steady selling. The overall trend is still pointing down, but this week’s bounce and the uptick in open interest show traders are starting to pay attention. If there’s no breakout soon, the price might just stay stuck in a narrow range. But if buyers manage to push Kaspa above the $0.080 level with momentum, a move toward that long-term trendline could be on the table.
Read Also: TRON Just Slashed TRX Supply – Is This the Start of a Massive Repricing?
Subscribe to our YouTube channel for daily crypto updates, market insights, and expert analysis.

We recommend eToro
Wide range of assets: cryptocurrencies alongside other investment products such as stocks and ETFs.
Copy trading: allows users to copy the trades of leading traders, for free.
User-friendly: eToro’s web-based platform and mobile app are user-friendly and easy to navigate.