
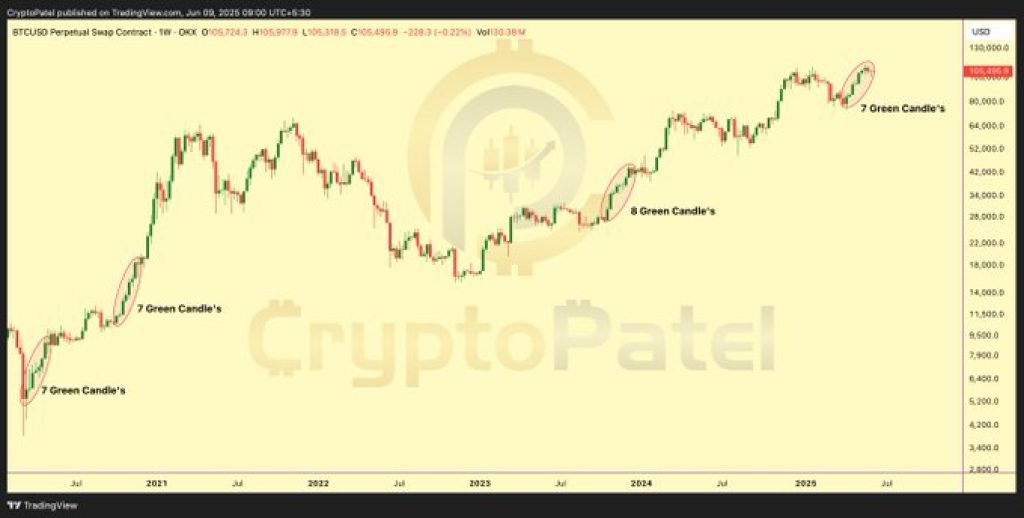
Bitcoin price might be playing out the same script we’ve seen before, and traders are paying close attention. Over the past seven weeks, BTC has printed seven straight green candles on the weekly chart. If that sounds familiar, it’s because the same thing happened in both 2021 and 2023. And just like those times, the eighth candle this week turned red.
This repeating pattern has caught the eye of Crypto Patel, who pointed it out on X. He shared a chart showing how Bitcoin’s momentum tends to stall right after that seventh green candle. “Bitcoin just printed 7 green weekly candles again… but FAILED to print the 8th, just like before,” he posted. Traders remember what came next in the past: a pullback, some sideways action, and then, eventually, a new leg up.
The key now is whether Bitcoin price can hold above the current support range, which sits between $98,000 and $102,000. If it does, this could just be a quick breather before the next move higher. The BTC chart still shows a strong bullish structure, higher highs, higher lows, and no signs of breaking down just yet.
With both Crypto Patel and CryptoBullet weighing in, the talk around a $119,000 target is heating up again.
What you'll learn 👉
Fibonacci-Based Target Points to $119K For BTC Price
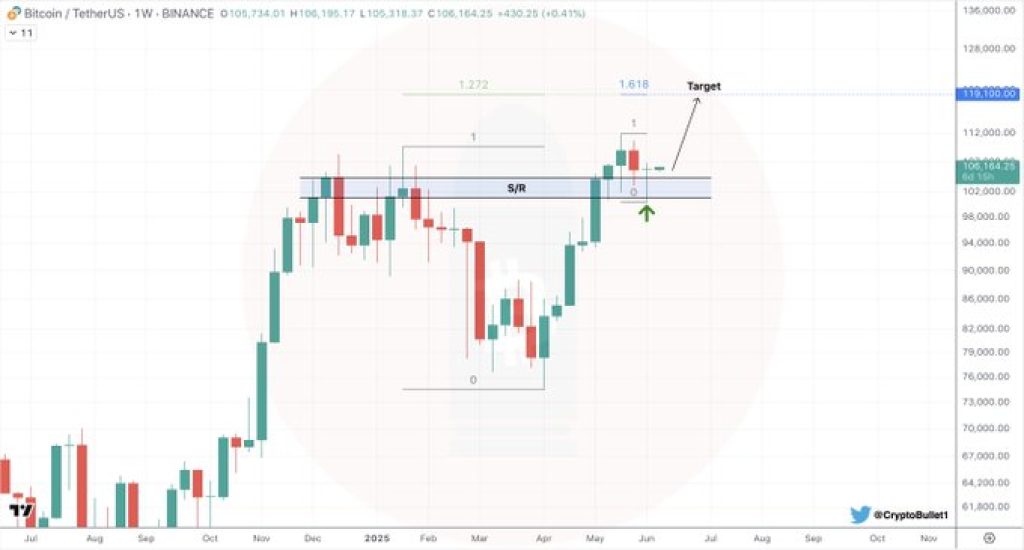
Meanwhile, CryptoBullet has identified a bullish structure on the weekly BTC chart using Fibonacci extension levels. In his analysis, he notes that Bitcoin has already cleared the 1.272 extension and is now holding above a key support/resistance zone between $98,000 and $104,000. This zone, which previously acted as resistance in late 2024 and early 2025, has now flipped into support following a successful retest.
CryptoBullet’s chart outlines a clear target at the 1.618 Fibonacci extension, which sits near $119,000. His tweet states, “Brilliant weekly close! I think $BTC is ready to go higher,” pointing to the strong close above the S/R zone as a positive signal for continuation.
BTC Market Structure and Trend Confirmation
The broader market trend remains in a bullish configuration. After correcting in March and April 2025, Bitcoin price formed a new higher low and pushed upward, completing a clean impulse move. The post-retest structure is typically seen as favorable for further gains if buyers maintain control above key support levels.
Price has remained above $104,000 for multiple weekly closes, adding strength to the bullish case. Any sustained move below this range could delay upward movement, with possible downside toward the $90,000 zone. However, as long as Bitcoin stays above the flipped support level, technical analysis suggests a continuation to higher levels remains on the table.
Analysts Track Bitcoin Support Holding Before Next Breakout
The zone between $98,000 and $104,000 remains the primary focus for traders watching the next move. If Bitcoin price maintains its position above this support, the path toward the projected $119,000 target becomes more plausible. Both Crypto Patel and CryptoBullet highlight that while short-term pullbacks are possible, the long-term structure favors trend continuation, pending confirmation in the coming weeks.
Volume, institutional inflows, and macroeconomic indicators will remain essential in determining if Bitcoin can break beyond historical candle patterns and finally exceed its previous highs.
Read Also: Why 1% of XRP Holders Might Not Be Rich – And What You Should Learn From It
Subscribe to our YouTube channel for daily crypto updates, market insights, and expert analysis.

We recommend eToro
Wide range of assets: cryptocurrencies alongside other investment products such as stocks and ETFs.
Copy trading: allows users to copy the trades of leading traders, for free.
User-friendly: eToro’s web-based platform and mobile app are user-friendly and easy to navigate.