
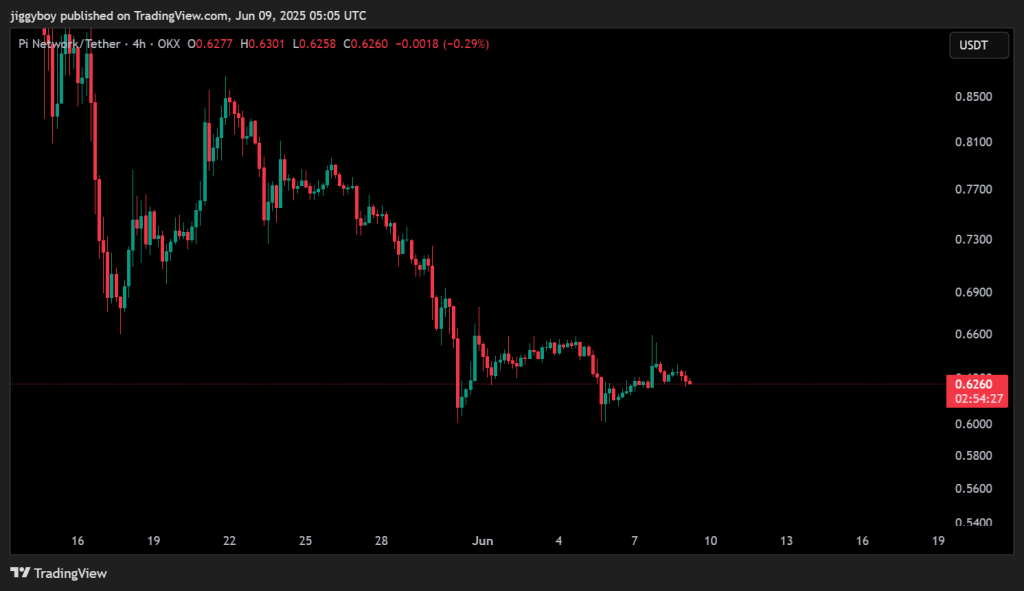
Pi Coin continues to consolidate following a steep downtrend that began in mid-May. After sliding from above $0.85 to the current price of $0.6266, the token has entered a phase of low volatility and limited momentum. Price is moving in a tight horizontal range between $0.61 and $0.66, while trading volume is down by 32.85%, reflecting hesitation across the market.
Let’s break down today’s outlook.
What you'll learn 👉
📅 What We Got Right Yesterday
Yesterday’s outlook outlined three possible price paths: bullish, neutral, and bearish. So far, the neutral scenario is unfolding, with Pi Coin price hovering between $0.61 and $0.64. This range has held firm for several days now, confirming that both buyers and sellers are currently in balance.
We also flagged the $0.66 level as a key resistance to watch. Despite a brief attempt to break higher, the price failed to close above this threshold. This validates the current sideways movement and reinforces the idea that a stronger breakout catalyst is still missing.
📊 Pi Coin Daily Overview (June 9)
- Current Price: $0.6266
- 24h Change: -0.95%
- Hourly RSI: 42.19
- Trading Volume: Down 32.85%
Pi Coin price action on the 4H chart remains confined within a consolidation channel. The $0.61–$0.62 zone continues to serve as support, while the upper boundary near $0.66 remains unbroken. A lack of strong candles and fading volume signals a wait-and-see mood among traders.
🔍 What the Pi Coin Chart Is Showing
The recent price pattern points to a bearish consolidation following weeks of decline. After falling from the $0.85 level, Pi Coin has not shown signs of a confirmed reversal. Lower highs and lower lows are still visible on the larger structure, and unless buyers reclaim $0.66 with conviction, another dip remains possible.
Volume has dropped during this sideways range, which typically precedes a breakout. Traders are watching to see if the token will test lower supports or finally build strength for a move upward.
📈 Technical Indicators (Hourly Timeframe)
| Indicator | Value | Signal / Interpretation |
| RSI (14) | 42.19 | Weak momentum, leaning bearish |
| MACD (12,26) | -0.001 | Bearish crossover, low intensity |
| ADX | 15.85 | Weak trend strength, sideways market |
| CCI (14) | -107.46 | Bearish pressure, oversold territory |
| Ultimate Oscillator | 35.50 | Negative momentum, no buy pressure |
| ROC (Rate of Change) | -1 | Gradual decline, bearish signal |
| Bull/Bear Power (13) | -0.0046 | Slight bearish control |
Summary: Momentum indicators are stacked to the bearish side, though none signal an imminent breakdown. The overall tone remains soft, with no directional momentum building yet.
🔮 Pi Coin Price Prediction Scenarios
Bullish Scenario: A 4-hour candle close above $0.66 could open short-term upside toward $0.70–$0.73, but volume confirmation is required.
Neutral Scenario: The Pi Coin price may continue moving sideways between $0.61 and $0.66, with weak participation on both sides.
Bearish Scenario: A confirmed breakdown below $0.61 could expose $0.60 and possibly lead to a drop toward $0.58.
🧠 Wrapping Up
Pi Coin price is in a low-momentum zone with mixed signals. Price has stabilized after a prolonged decline, but bears still maintain a slight edge. Traders are monitoring the $0.61 support and $0.66 resistance closely. Until either level breaks, sideways movement remains the most probable short-term path.
Read Also: Here’s Why Internet Computer (ICP) Price Is Pumping
Subscribe to our YouTube channel for daily crypto updates, market insights, and expert analysis.

We recommend eToro
Wide range of assets: cryptocurrencies alongside other investment products such as stocks and ETFs.
Copy trading: allows users to copy the trades of leading traders, for free.
User-friendly: eToro’s web-based platform and mobile app are user-friendly and easy to navigate.