Pi Coin enters Tuesday with low volatility after a steady slide and brief recovery over the weekend. The token is now trading around $0.6460 after rebounding from just above $0.60 at the start of June. While Pi Network price action remains subdued, technical indicators suggest a potential shift in momentum is forming, though confirmation is still lacking.
Let’s break down today’s outlook.
What you'll learn 👉
📅 What We Got Right Yesterday
In yesterday’s prediction, we laid out three potential scenarios for Pi Coin. The neutral case pointed to a likely consolidation phase between $0.63 and $0.67 if resistance at $0.66 held. So far, that’s played out exactly as expected. The token has remained stuck in a tight range near $0.645–$0.660, failing to break out convincingly.
The Pi Coin chart also warned of weak momentum and a lack of bullish confirmation, which is still visible in today’s price structure. Sellers haven’t pushed the price below support, but buyers haven’t been able to flip short-term resistance either.
📊 Pi Coin Daily Overview (June 3)
- Current Price: $0.6460
- 24h Change: +0.80%
- Volume: Down 15.74%
- 4H RSI: 51.37
Pi Coin price continues to hover just below key resistance, with very tight candle formations showing indecision. Volume is declining, and the 4H RSI is sitting at a balanced level, reflecting a sideways market. Key support remains in the $0.600–$0.615 range, while immediate resistance stands at $0.660–$0.665.
🔍 What the Pi Coin Chart Is Showing
The 4H chart shows a base-forming pattern after a series of lower highs and lower lows throughout late May. Since bouncing from the $0.60 region on June 1, Pi Coin price has entered a consolidation phase. The lack of sharp selloffs indicates selling pressure may be easing, but there’s not enough bullish momentum yet to suggest a reversal.
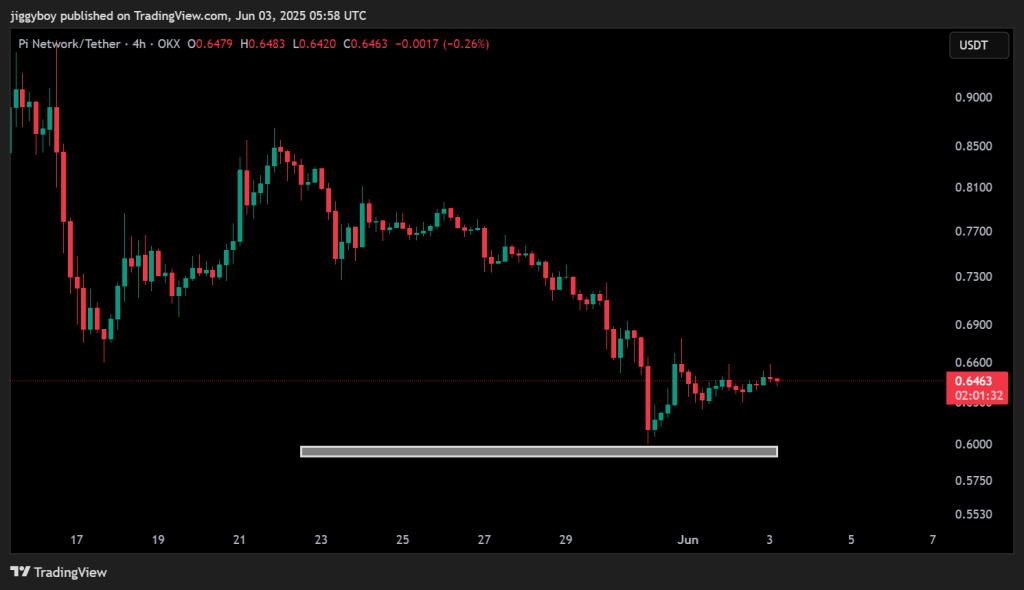
Multiple attempts to break above $0.66 have failed. Without a strong volume breakout, the token is likely to stay stuck in this narrow band. A close above $0.665 would be the first signal for any bullish continuation.
📈 Technical Indicators (Hourly Timeframe)
| Indicator | Value | Signal / Interpretation |
| MACD (12,26) | -0.002 | Mild bullish crossover (Buy signal) |
| ADX | 32.61 | Trend forming, no direction confirmation |
| RSI (14) | 51.37 | Neutral momentum |
| CCI (14) | -35.84 | Slight bearish pressure |
| Ultimate Oscillator | 46.29 | Weak sell bias |
| ROC (Rate of Change) | +0.291 | Mild bullish momentum |
| Bull/Bear Power (13) | -0.003 | Slight bearish dominance |
Summary: Most indicators lean neutral, with a slight bullish tilt from MACD and ROC. However, bearish signals from the Ultimate Oscillator and Bear Power suggest bulls have yet to take full control. The overall technical setup remains indecisive.
🔮 Pi Coin Price Prediction Scenarios
Bullish Scenario: A break above $0.66 with follow-through to $0.70 could set up a move toward $0.75 or $0.85.
Neutral Scenario: If the Pi Coin price stays between $0.63 and $0.66, consolidation may continue through midweek.
Bearish Scenario: A drop below $0.60 could expose downside targets at $0.58 and $0.54.
🧠 Wrapping Up
Pi Network price is currently moving sideways after a bounce from key support. Technicals and price action both reflect indecision. Traders should continue to monitor volume and resistance near $0.66 for any signs of a directional breakout. For now, the most probable path is continued range-bound movement as buyers and sellers battle for control.
Read Also: XRP Price to $75 This Summer? Bold Prediction Sparks Heated Debate
Subscribe to our YouTube channel for daily crypto updates, market insights, and expert analysis.

We recommend eToro
Wide range of assets: cryptocurrencies alongside other investment products such as stocks and ETFs.
Copy trading: allows users to copy the trades of leading traders, for free.
User-friendly: eToro’s web-based platform and mobile app are user-friendly and easy to navigate.