On the surface, things aren’t looking too hot for Kaspa. According to the latest sentiment data, community confidence has dropped to its lowest point in the past 30 days. It’s the kind of stat that usually raises eyebrows, especially in a market where emotion often drives price.
But the real story might not be in the sentiment charts – it’s in the behavior of the holders.
Even as short-term mood cools down, the number of mid- to long-term holders continues to rise. That’s a key detail. It means that while traders and speculators might be losing steam, the core of the community – the people who believe in Kaspa’s long-term vision – is only getting stronger.
To be clear – this kind of divergence isn’t new in crypto. It’s the classic dynamic between emotion and conviction. Retail sentiment tends to swing with price action, while long-term believers often use these dips as quiet accumulation zones. And looking at Kaspa’s chart, there’s definitely some story to unpack there too.
Kaspa community remains one of the most committed in the space, yet sentiment has now dropped to a 30-day low.
— Kaspa Daily (@DailyKaspa) May 26, 2025
This comes even as the number of mid- to long-term holders continues to increase, reflecting growing conviction beneath the surface.
Short-term sentiment may be… pic.twitter.com/7Gk275fO17
Kaspa (KAS) is currently trading around $0.107, after pulling back from a local high of over $0.13 earlier in May. On the 4-hour chart, the price has recently fallen below the 200-day moving average, which sits around $0.1098. That’s a critical level. For now, Kaspa seems to be struggling to reclaim that support, signaling a short-term bearish bias.
What’s also noticeable is the compression happening after a strong April rally. Back then, Kaspa went from around $0.07 to over $0.13 in a relatively short period. Since then, the KAS price has been consolidating in a broad range between $0.10 and $0.12, with occasional spikes up and sharp corrections down. That kind of sideways action often leads to market fatigue, especially among short-term traders. It helps explain the drop in sentiment.
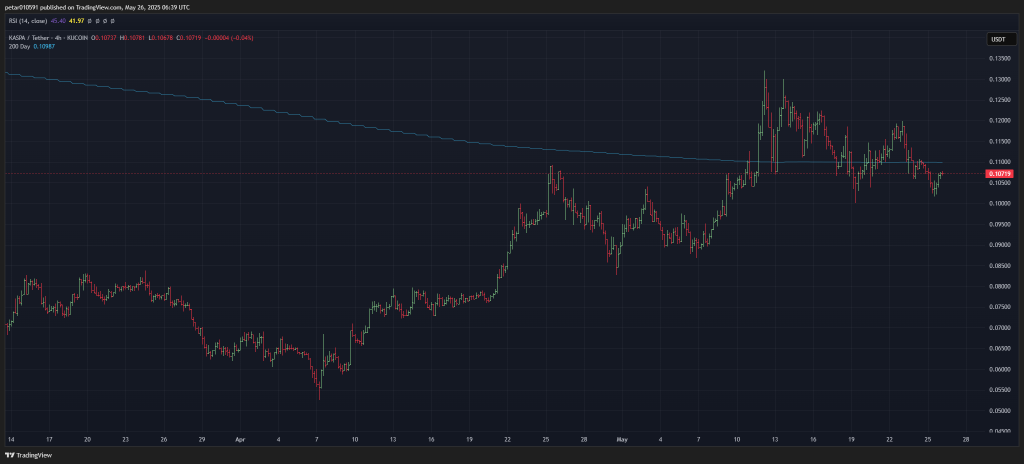
However, the RSI (Relative Strength Index) on this 4-hour chart is sitting around 42, which suggests Kaspa is nearing oversold territory. That doesn’t guarantee a bounce, but it does show that the selling pressure may be easing – or at least that buyers might soon step in.
So where does this leave us?
Kaspa is in a cooling phase. Momentum has slowed. Sentiment is shaky. But long-term holders are holding tight, and that’s not something to overlook. When price chops sideways, it’s often the most impatient who exit first, while seasoned believers keep accumulating in the background.
Kaspa’s technicals might look heavy in the short term, but its fundamentals and community resilience are still intact. If price can reclaim the 200-day average and break back above the $0.115 zone, sentiment could shift quickly. Until then, it’s a game of patience, and conviction.
Because while the charts show a dip, the behavior on-chain is telling a deeper story.
Read also: Can Kaspa (KAS) Reach $10 by 2030?
Subscribe to our YouTube channel for daily crypto updates, market insights, and expert analysis.

We recommend eToro
Wide range of assets: cryptocurrencies alongside other investment products such as stocks and ETFs.
Copy trading: allows users to copy the trades of leading traders, for free.
User-friendly: eToro’s web-based platform and mobile app are user-friendly and easy to navigate.