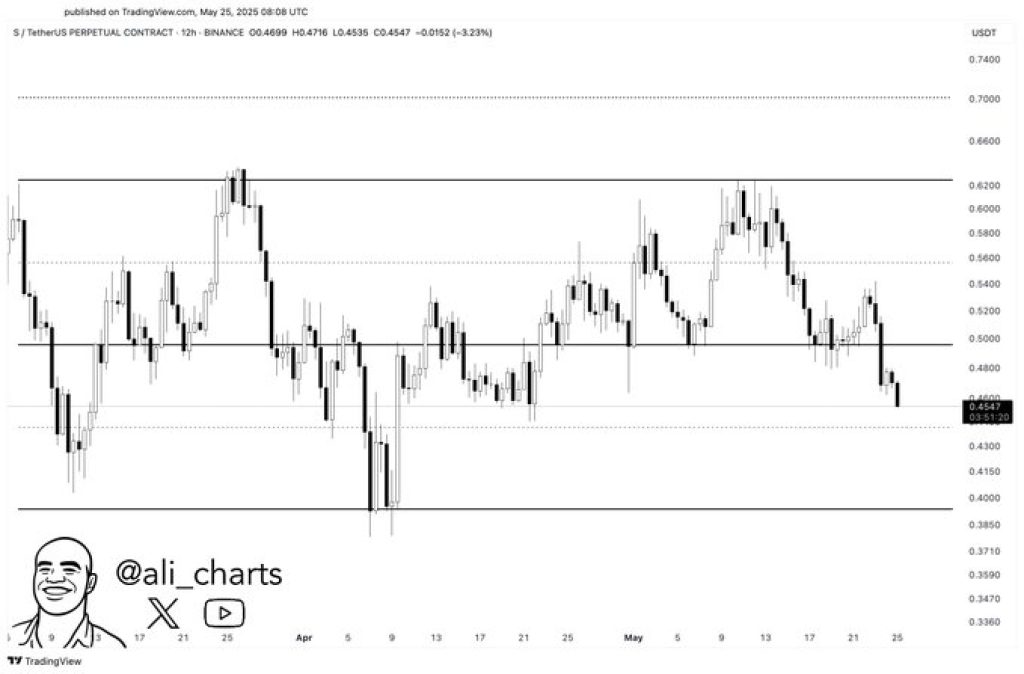
Sonic (S) is heading toward a pretty big decision point on the chart. According to crypto expert Ali, all eyes are now on the $0.395 support level, a zone that acted as a solid launchpad back in early April. In a chart shared today, the Sonic price had already slipped to $0.4547, down more than 3% on the day.
In his tweet, Ali pointed out that $0.395 is the level to watch. If buyers step in again, we could see a bounce. But if that support gives way, things could get rough. The market reacted strongly to this zone once before, but it’s not guaranteed to hold up the second time around.
What you'll learn 👉
Sonic Price Structure Shows a Sustained Downtrend
The 12-hour Sonic chart reflects a steady bearish structure. After peaking near $0.62 earlier in May, the price formed a double-top pattern. Since then, Sonic has declined through several support zones, including the mid-range between $0.4850 and $0.5000. That level, which once acted as support, is now considered a resistance zone following the recent breakdown.
The next major support is $0.395. If this level breaks, historical data suggests the Sonic price could move quickly toward the $0.3750–$0.3850 range. Traders monitoring the chart will likely be watching how the token reacts if it tests that area.
Sonic Support Levels Are Now Acting as Resistance
Several key levels have shifted roles over the past few weeks. The range between $0.4850 and $0.5000 acted as a pivot point throughout April. However, after the latest drop, the price has failed to reclaim that zone. The inability to move above that range confirms the downtrend’s strength.
The lower support near $0.395 remains active and unbroken for now. That level provided the base for a sharp reversal in early April. If Sonic price fails to bounce there again, a deeper correction becomes more likely.
Read Also: XRP Price to $27? Here’s the Target Date Analysts Are Watching
Sonic Technical Signals Reflect Weak Buyer Presence
Visual observations of the chart show long candle wicks and low follow-through on attempted rebounds. These characteristics often suggest hesitation among buyers. Momentum appears to have slowed, and trading volume likely decreased based on price behavior.
The market structure remains bearish with lower highs and lower lows. Without a shift in momentum, support tests may result in further losses. A bounce from the $0.395 area would need strong volume to confirm a reversal toward higher resistance zones for Sonic price.
Moreover, Ali’s tweet confirms the $0.395 level as the immediate zone to watch. It serves as a clear signal for market participants awaiting either a short-term rebound or further decline. The tweet states:
“#Sonic $S is heading back to retest the $0.395 support level. This is a key zone to watch for a potential bounce or breakdown.”
As of now, the market is approaching this level with caution. Traders will likely look for confirmation signals before committing to either side.
Subscribe to our YouTube channel for daily crypto updates, market insights, and expert analysis.

We recommend eToro
Wide range of assets: cryptocurrencies alongside other investment products such as stocks and ETFs.
Copy trading: allows users to copy the trades of leading traders, for free.
User-friendly: eToro’s web-based platform and mobile app are user-friendly and easy to navigate.