SUI price has been moving in a strong uptrend ever since it broke out of a long downward channel that began early this year. After dropping from above $5, the token spent months trading inside a bearish descending channel. But that pattern finally ended when Sui broke the upper trendline in late April, leading to a powerful rally up to nearly $4.50.
Now, SUI price is in a cooling-off phase and currently trading between $3.5 and $3.7. This zone had acted as resistance during the breakout and is now acting as support.
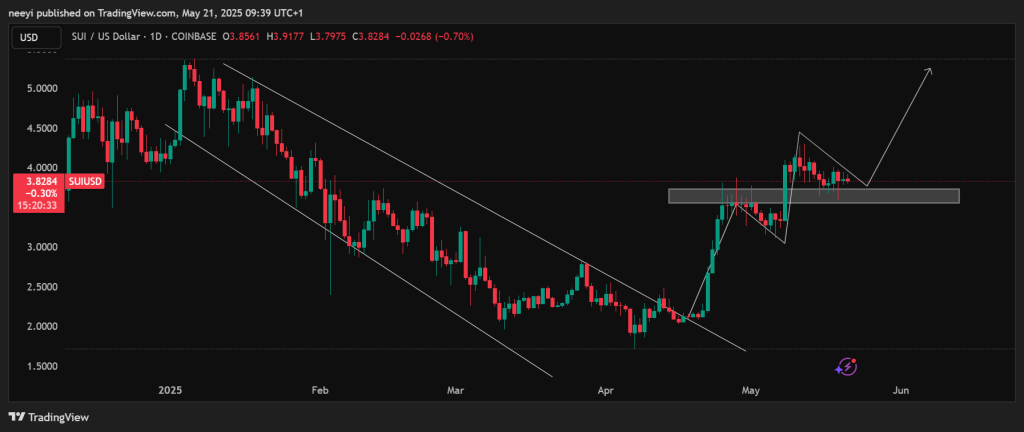
The daily chart shows the price pulling back toward this zone in a typical bullish continuation pattern. The structure resembles a bull flag, and if the price holds above this key level, SUI may be ready to launch its next leg upward.
ZAYK Charts Spots Falling Wedge as Breakout Nears
ZAYK Charts, a popular analyst on X, also pointed out a falling wedge on the 2-hour SUI chart. In their post, they showed how SUI has been compressing between lower highs and lower lows inside this wedge. This type of formation is usually a bullish setup, especially when it forms after a strong upward move.
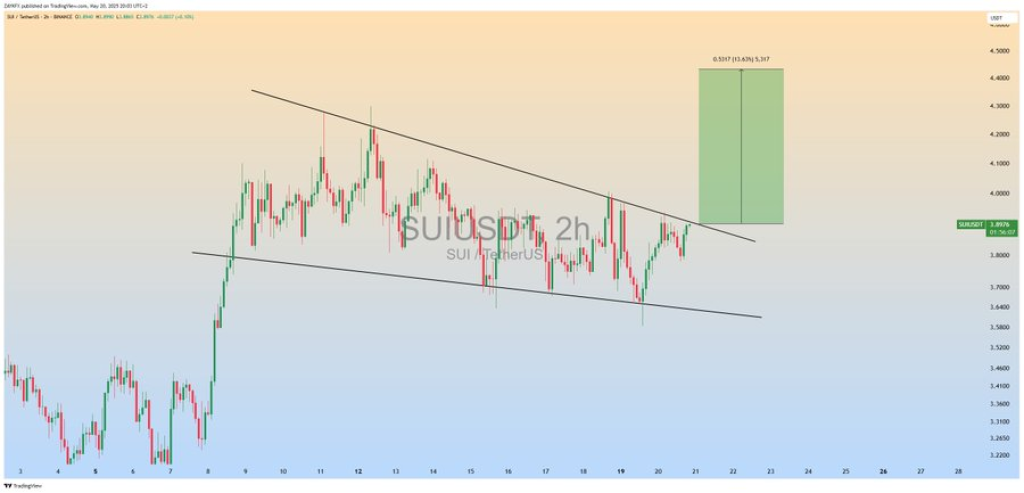
According to the chart ZAYK shared, a breakout from the wedge could take the SUI price up to about $4.35, representing nearly 13% growth from current levels.
Read Also: PEPE Price Prediction for June: Key Indicators Turn Bullish
That would line up with the top of the recent rally and could act as the next resistance to watch. If the wedge breaks out soon and volume supports the move, this would confirm that the recent dip was just a healthy consolidation phase.
Subscribe to our YouTube channel for daily crypto updates, market insights, and expert analysis.

We recommend eToro
Wide range of assets: cryptocurrencies alongside other investment products such as stocks and ETFs.
Copy trading: allows users to copy the trades of leading traders, for free.
User-friendly: eToro’s web-based platform and mobile app are user-friendly and easy to navigate.