
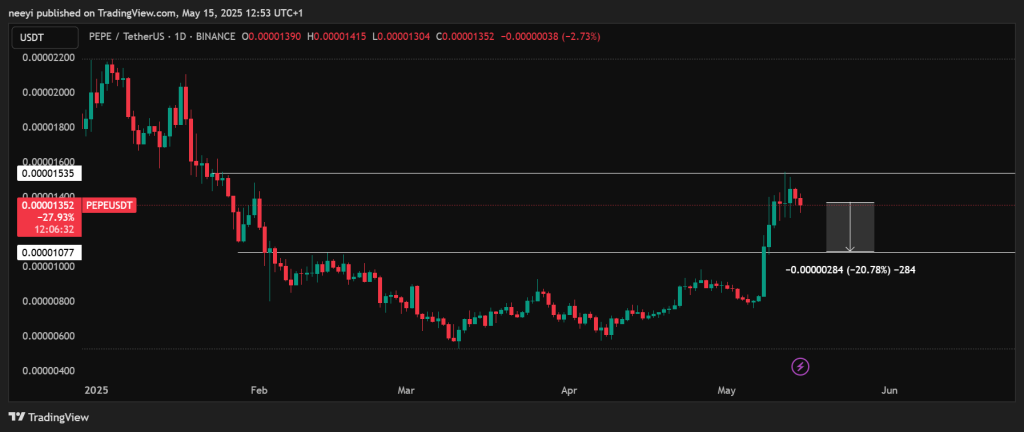
Over the past two weeks, Pepe (PEPE) surged nearly 100%, drawing renewed attention from traders hoping to ride the hype. But that excitement might be cooling off. The price is now hovering around $0.00001360 after failing to break through strong resistance near $0.00001535.
According to Ali Charts, one of the most reliable indicators for Pepe might be flashing a warning signal.
What you'll learn 👉
TD Sequential Indicator Turns Bearish on Pepe
Popular crypto analyst @ali_charts shared a chart showing the TD Sequential indicator on Pepe’s daily chart. This tool has historically been very accurate in predicting Pepe’s short-term moves. And now, it’s flashing a sell signal.
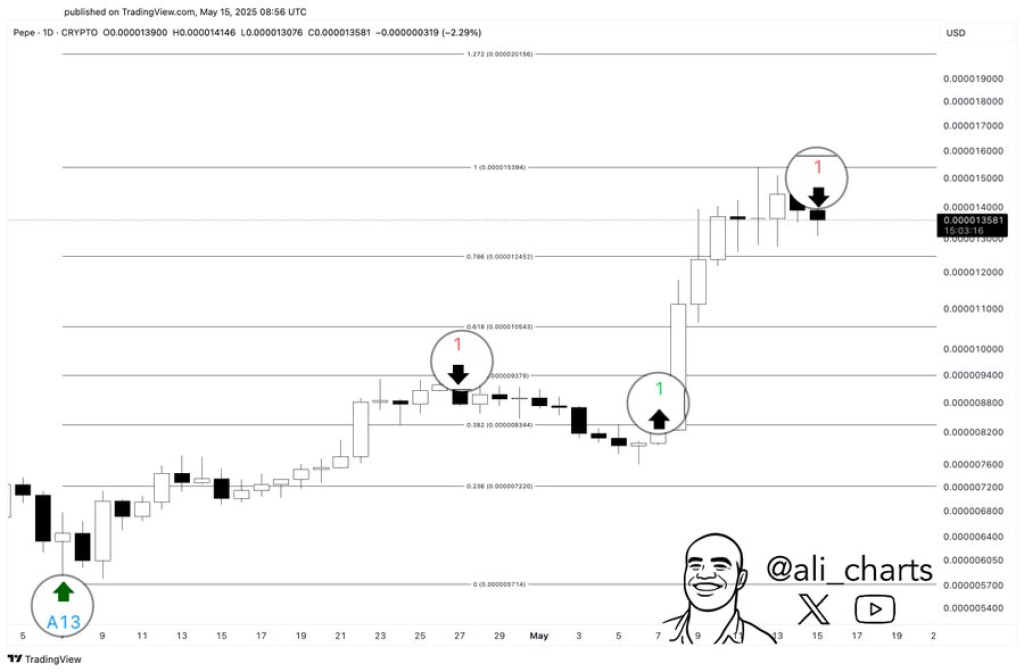
The chart reveals a red “9” candle at the top of the recent rally: the same signal that preceded two earlier pullbacks. Ali pointed this out in his post on X:
“The TD Sequential has been spot-on with $PEPE daily chart. And it’s now flashing a sell signal, suggesting a potential pullback ahead.”
What makes this more interesting is how precise the indicator has been so far. In late April, it flagged a “9” just before Pepe dropped. Then it marked a green “1” at the bottom of that drop, right before the coin exploded upward again. Now, with another red “9” showing, many traders are taking this as a sign to be cautious.
Technical Indicators Confirm Bearish Momentum for $PEPE
Beyond the TD Sequential, data from Investing.com also backs up the bearish outlook. Multiple technical indicators are flashing sell signals on the daily chart. Let’s break down what each one is telling us:
- RSI (Relative Strength Index) 14: At 42.902, this suggests a sell. RSI measures whether a coin is overbought or oversold. Below 50 usually points to weakening momentum.
- Stochastic Oscillator (STOCH 9,6): Reading 39.783, also a sell. This indicator highlights potential trend reversals and currently leans bearish.
- MACD (Moving Average Convergence Divergence 12,26): Neutral at the moment, meaning there’s no strong signal either way. But it doesn’t counter the other bearish signs.
- Ultimate Oscillator: At 46.743, this is another sell. It blends multiple timeframes to give a broader view of buying pressure, which seems to be fading.
- ROC (Rate of Change): With a value of -3.94, this also points to a sell. ROC tracks the speed of price movement and a negative number means momentum is slipping.
So, overall, most of these tools are lining up with the TD Sequential, hinting that Pepe’s recent run might be out of breath.
Read Also: Aptos (APT) Chart Signals Massive Bull Run Is Just Getting Started
What’s Next for Pepe Price?
If the pullback continues, the next major support level to watch is around $0.00001077. That would be close to a 20% drop from current prices. It’s a level where buyers previously showed interest, so it could be a potential bounce zone if the selloff deepens.
That doesn’t mean $PEPE is finished. Memecoins are known for their volatility and surprises. But right now, the technical side is clearly signaling caution.
As always, it’s not just about hype, understanding the charts and indicators can make all the difference. And for Pepe, the message at the moment is clear: a cooldown might be just around the corner.
Subscribe to our YouTube channel for daily crypto updates, market insights, and expert analysis.

We recommend eToro
Wide range of assets: cryptocurrencies alongside other investment products such as stocks and ETFs.
Copy trading: allows users to copy the trades of leading traders, for free.
User-friendly: eToro’s web-based platform and mobile app are user-friendly and easy to navigate.