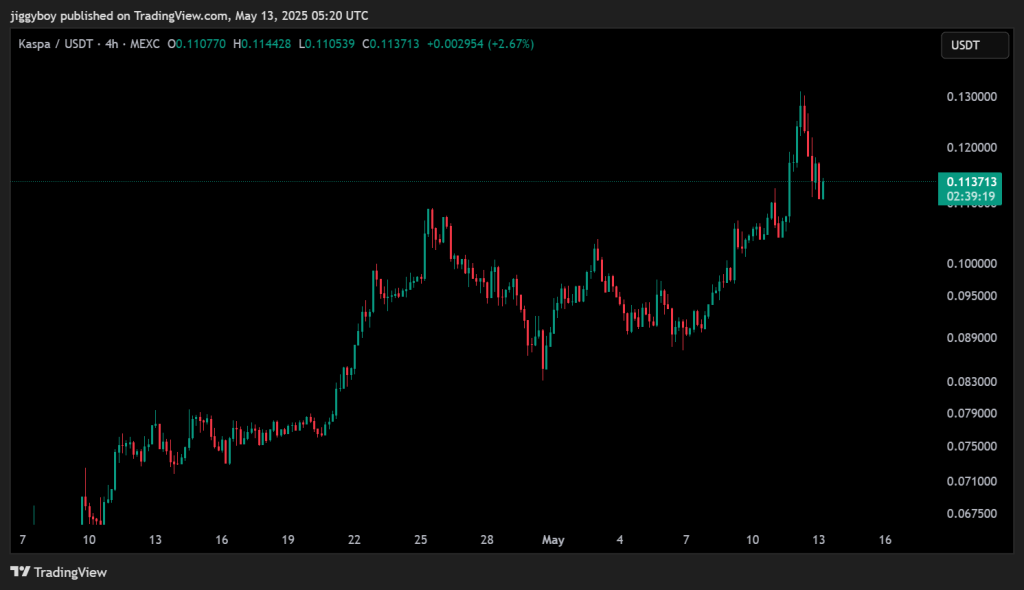
Kaspa is cooling off after a strong rally, which took prices above the $0.13 mark earlier this week. After climbing aggressively from $0.080, KAS price faced resistance near $0.131 and quickly pulled back to around $0.112. While the token is now showing signs of stabilizing, technical indicators suggest momentum has faded, at least for now.
Despite the dip, Kaspa is still holding onto most of its recent gains, and the current support zone around $0.111–$0.113 is acting as a battleground between bulls and bears. Trading volume is up by 35%, showing that interest remains high even during this pullback.
What you'll learn 👉
What the Kaspa Chart Is Showing
The 4-hour chart still supports a bullish structure, but short-term weakness is setting in. KAS price action has maintained higher highs and higher lows since late April, but the failure to hold above $0.13 may mark a temporary top.
Resistance has now formed at $0.129–$0.131, with a smaller resistance band between $0.120 and $0.122. Support sits just beneath current prices in the $0.111–$0.113 zone. If this level breaks, the next strong support lies at $0.104–$0.107, the consolidation base before the last breakout. A deeper slide could open a move down toward the $0.098–$0.100 psychological zone.
Technical Indicators (Hourly Timeframe)
| 📊 Indicator | Value | Interpretation |
| 💡 RSI (14) | 42.39 | Bearish momentum, not oversold yet |
| 🔻 MACD (12,26) | -0.001 | Mild bearish crossover |
| 🧭 CCI (14) | -112.22 | Oversold, watch for a bounce |
| 🌀 Ultimate Oscillator | 41.81 | Weak momentum, selling pressure |
| 📉 ROC | -6.1 | Strong drop in recent price movement |
| 🐻 Bull/Bear Power (13) | -0.0082 | Bears have short-term control |
Indicator Analysis (Textual)
RSI is sitting in the low 40s, showing bearish pressure but not yet signaling panic selling. MACD is slightly negative, suggesting mild bearish divergence after the recent high. CCI is oversold, which could open the door for a relief bounce.
The Ultimate Oscillator is still under 50, reflecting weak demand. ROC shows a sharp decline in momentum, and Bull/Bear Power confirms that sellers are controlling this pullback phase.
Read Also: Crypto Veteran Warns: XRP Triangle Breakout Could Shock the Market
Kaspa Price Forecast for Today (May 13)
1. Pessimistic Case
- Target: $0.098 – $0.104
- If the $0.111 support fails to hold, KAS price could extend its decline toward the stronger base zone below $0.105. This would suggest a deeper retracement before bulls return.
2. Realistic Case
- Target: $0.112 – $0.120
- Price may hover around current levels and consolidate between $0.112 and $0.120. This would align with fading momentum indicators and profit-taking from earlier gains.
3. Optimistic Case
- Target: $0.125 – $0.130
- If support at $0.111 holds firm and buyers step back in, Kaspa price could make another push toward $0.130 resistance. A break above $0.122 would be the first sign that bulls are regaining strength.
Subscribe to our YouTube channel for daily crypto updates, market insights, and expert analysis.

We recommend eToro
Wide range of assets: cryptocurrencies alongside other investment products such as stocks and ETFs.
Copy trading: allows users to copy the trades of leading traders, for free.
User-friendly: eToro’s web-based platform and mobile app are user-friendly and easy to navigate.