Uniswap is back on traders’ radar after a strong bounce from its recent lows. The token was stuck below $5 for most of April, but then it suddenly shot up to $7.55 before pulling back a bit.
Now, UNI price is trading around $7.07 after dropping about 6% in a day. Many are wondering if that was the start of a bigger move, or did they miss the boat?
What you'll learn 👉
What the Uniswap Chart and Indicators Are Saying
The price chart shows a clear breakout from the long downtrend that stretched from January through early May. UNI price lost more than 65% of its value during that decline, dropping from over $16 to under $5. But the recent move changed the structure, with a strong leg up that formed a higher high.
Price is now pulling back and testing the $6.50–$7.00 zone, which previously acted as resistance and may now flip into support. If this area holds, bulls could target the 200-day simple moving average (SMA), currently at $9.59. That level could act as the next key resistance, followed by the psychological barrier at $10.
Read Also: Here’s Why Arbitrum Price Is Pumping and What ARB Chart Is Telling Us
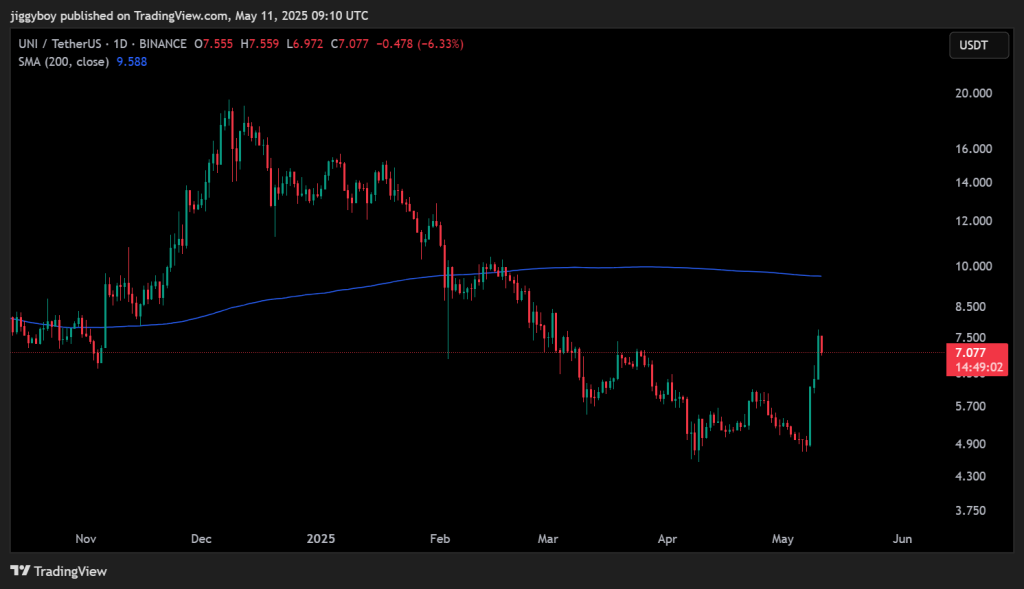
On the downside, a break below $6.50 might expose Uniswap to a retest of the $6.00 or even $5.70 region. The token’s base remains intact between $4.30 and $4.90, where buyers previously stepped in.
Uniswap price is trading at $7.0892 at writing. It has recorded an 8.26% gain over the past day, with trading volume climbing by 35%, signaling growing interest and activity.
A look at the daily technical indicators suggests strong short-term momentum, though there are also signs that UNI may need to cool off.
| Indicator | Value | Interpretation |
| MACD | 0.234 | Bullish crossover |
| CCI | 210.15 | Overbought territory |
| Ultimate Oscillator | 67.31 | Positive momentum across timeframes |
| Rate of Change (ROC) | 27.54 | Strong upward price movement |
| Bull/Bear Power | 2.605 | Buyers still dominant |
The MACD remains above the signal line, indicating bullish pressure is still present. The Rate of Change confirms a strong uptrend, while the Bull/Bear Power reflects buying interest. However, the CCI above 200 suggests UNI price may be temporarily overextended, and some short-term consolidation or pullback wouldn’t be surprising.
Read Also: Cardano Whales Just Bought 40M ADA – What Comes Next?
Uniswap Price Forecast
If UNI holds above the $6.70 level and regains strength above $7.50, the next logical target is the $9.00–$9.50 range, aligning with the 200-day moving average. A sustained move above that could open the door to $10 and beyond.
On the flip side, a break below $6.50 could shift momentum back in favor of the bears. In that case, traders may look toward the $6.00 zone or the mid-$5 range for the next possible rebound.
So, is it too late to buy UNI?
Not necessarily, but it’s not an early entry either. The strongest gains from the $5.00 breakout have already occurred. Right now, the UNI price appears to be in a consolidation phase. Whether it leads to another breakout or a deeper pullback will likely depend on broader market conditions and the token’s ability to hold current support. For now, it’s a moment of waiting, not chasing.
Read Also: Ethereum Price to Hit $10,000? ETH Whales Accumulate ‘Like Never Before’
Subscribe to our YouTube channel for daily crypto updates, market insights, and expert analysis.

We recommend eToro
Wide range of assets: cryptocurrencies alongside other investment products such as stocks and ETFs.
Copy trading: allows users to copy the trades of leading traders, for free.
User-friendly: eToro’s web-based platform and mobile app are user-friendly and easy to navigate.