Injective is starting to turn heads again as its weekly chart hints at a possible bullish reversal. The price of INJ has climbed up from a multi-month low and is now approaching a key resistance level that many traders are keeping an eye on. One of them is CryptoRand, a top analyst, who posted on X that a breakout above $10 could trigger a much bigger move.
At writing, INJ price is trading at around $9.39, just under that $10 mark. It’s a level that’s getting a lot of attention, with traders watching closely to see if the token can break through and start a stronger rally, or if it’s going to get rejected and slip back into its range.
What you'll learn 👉
Injective Price Structure and Trendlines
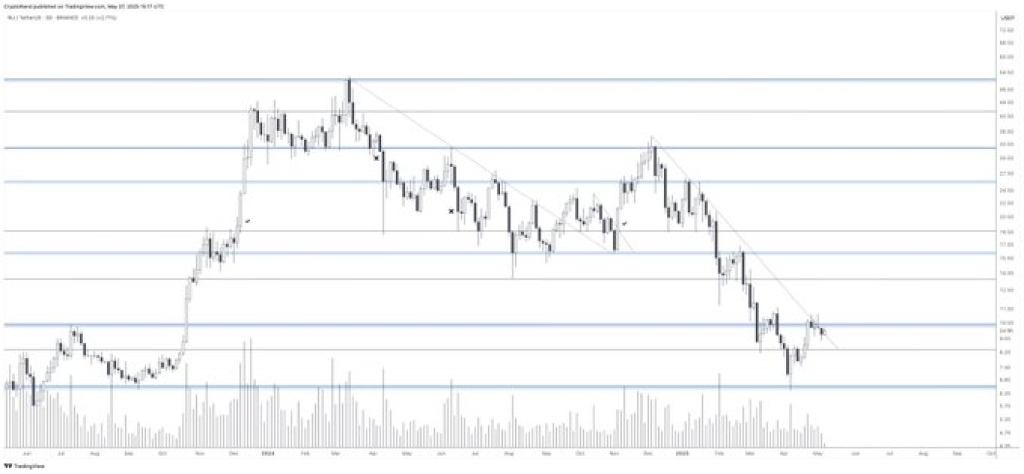
The weekly candlestick chart shows INJ attempting to shift from a long-term downward trend. The price of Injective has consistently respected a descending trendline from its all-time high around $25 to $28. However, recent candles indicate a break above this line, suggesting the end of the extended bearish phase.
The current pattern resembles a falling wedge breakout, typically associated with trend reversals. Supporting this view, the chart also shows a rounded bottom formation that reflects prolonged accumulation between $6 and $10. This range has seen steady buying interest over the past several months, according to the chart structure.
Read Also: 3 Reasons ONDO Might Be One of the Best Crypto Bets This Cycle
INJ Price Support and Resistance Zones
Historical price activity highlights key levels acting as both support and resistance. The $6.00 to $6.20 area served as a reliable support zone during the previous pullback. A secondary support lies near the $8.00 mark, which has also held during past drawdowns.
On the upside, $10 remains the most immediate resistance. This level has repeatedly acted as a turning point, and the current weekly candle is testing it. Should INJ price sustain above $10, resistance at $12 and $14 could follow. Further above, areas around $18 to $25 remain longer-term targets, though dependent on continued upward momentum.
Furthermore, volume activity shows a gradual increase on green candles, pointing toward growing interest during upswings. Although a volume climax is not yet visible, steady participation has helped push the price upward from support zones. If this trend continues, it could support higher price action in the near term.
The analysis by CryptoRand aligns with this observation. His tweet noted that a breakout over $10 would trigger a bullish reversal. The combination of technical setups and growing trading volume strengthens the possibility of a shift in structure.
INJ Price Outlook and Risk Levels
If INJ maintains its current trajectory and confirms a breakout above $10, the price could target the $12 and $14 resistance zones. This would represent a potential doubling from its recent lows. However, failure to hold this level may lead to a retracement toward $8 or even the $6 support area.
Traders are watching the chart closely as the token hovers at a technical inflection point. Whether Injective price confirms its bullish reversal or reverts into a consolidation phase will likely depend on price reaction to the $10 zone in the coming sessions.
Subscribe to our YouTube channel for daily crypto updates, market insights, and expert analysis.

We recommend eToro
Wide range of assets: cryptocurrencies alongside other investment products such as stocks and ETFs.
Copy trading: allows users to copy the trades of leading traders, for free.
User-friendly: eToro’s web-based platform and mobile app are user-friendly and easy to navigate.