
Chainlink (LINK) Price Is Coiling for a Breakout as Onchain Metrics and Chart Patterns Point to $15 Showdown

Chainlink price is tightening up on the monthly chart, trading right near a key level that could decide its next big move. Two analysts, X Finance Bull and Ali, have pointed out some interesting signals, both from the charts and on-chain activity, that hint at a potential breakout or breakdown. Right now, price action and resistance zones seem to be meeting at the same spot.
Looking at the long-term chart, LINK price has been climbing along a steady upward trendline since back in 2018–2019. Even during the wider crypto market dips, LINK has managed to hold higher lows, bouncing off the same rising support line every time. That trendline now sits between $12.50 and $13.00 and has already proven itself during retests in 2022, 2023, and once again in early 2025.
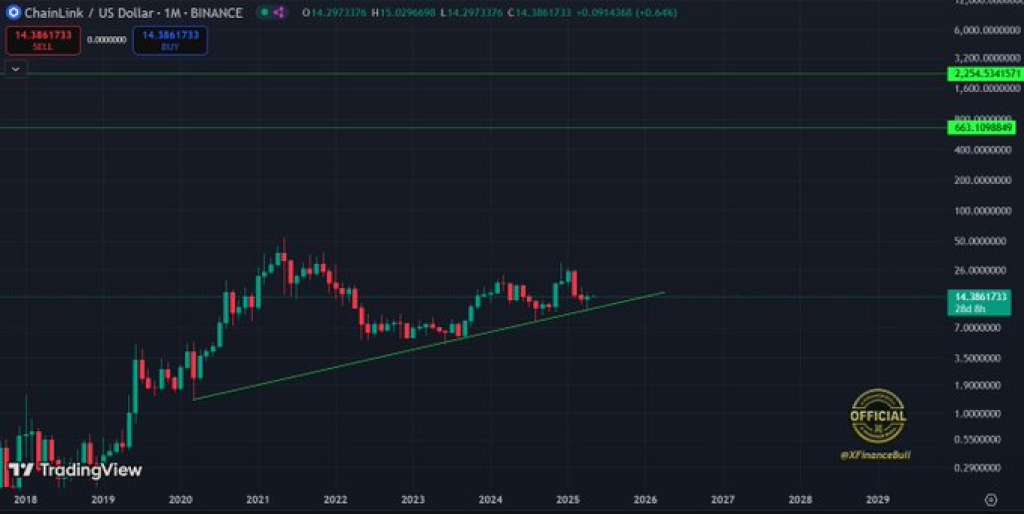
At the time of the post, LINK was trading at $14.38. X Finance Bull describes it as “coiling like a spring,” suggesting a big move is just around the corner. He also pointed out that Chainlink’s real-world use cases are growing fast, adding more weight to the possibility of a bullish breakout.
While long-term resistance levels like $25.45 and $66.11 are marked on the chart, most traders are keeping a close eye on what’s happening right now. For the moment, all eyes are on whether LINK price can break through the nearby barrier or pull back once more.
What you'll learn 👉
LINK $15 Resistance Cluster Stalls Breakout Attempts
An on-chain IOMAP chart shared by crypto expert Ali shows that the $15 zone presents considerable resistance. Between $14.79 and $15.29, over 68 million LINK are held by more than 220,000 addresses. This concentration of tokens purchased above the current price may lead to sell-offs as traders attempt to exit at break-even.
The chart also displays lower price clusters, indicating areas of support. Addresses holding LINK between $13.23 and $13.85 remain in profit, reducing the likelihood of selling pressure from those zones. These ranges could stabilize Chainlink price during any downward movement.
Read Also: How Much Will 2,500 XRP Be Worth By 2026? XRP Price Prediction!
According to on-chain data from @intotheblock, key levels for #Bitcoin $BTC are:
— Ali (@ali_charts) May 3, 2025
• Support: $96,160
• Resistance: $98,290
A breakout from this range could set the next major move. pic.twitter.com/dfXPOJtvYx
Ali notes in his tweet that $15 remains the most notable resistance level. A break above this range could shift sentiment and lead to further price expansion.
Traders Monitor Chainlink Breakout Levels and On-Chain Patterns
The data suggests that LINK price is approaching a decision point. The combination of long-term trendline support and resistance from prior accumulation zones makes $15 a technical area of interest.
While market direction remains undecided, both charts and commentary signal increased focus on whether LINK can maintain momentum and push through. For now, traders await confirmation as Chainlink continues to trade within a narrow range near a structurally key level.
Subscribe to our YouTube channel for daily crypto updates, market insights, and expert analysis.

We recommend eToro
Wide range of assets: cryptocurrencies alongside other investment products such as stocks and ETFs.
Copy trading: allows users to copy the trades of leading traders, for free.
User-friendly: eToro’s web-based platform and mobile app are user-friendly and easy to navigate.


