Pi Coin closed lower yesterday, dropping by 2.20% to trade around $0.5770. The token continues to hover near a major support zone while showing signs of weakness across several technical indicators. As traders look for clues on the next move, Pi Network remains caught between selling pressure and an oversold setup.
Let’s see where the Pi Coin price could be headed today.
What you'll learn 👉
Pi Coin Chart Analysis
At writing, Pi Coin is trading at 0.5770 on the daily chart. The price has been in a steady downtrend since early March, with lower highs forming along a descending trendline. A recent attempt to break this trendline between April 25 and 28 failed, and the price has since returned to the support area between $0.57 and $0.52.
Read Also: How Much XRP Could Make You a Millionaire in Just a Few Years?
This zone has acted as a key defense level for buyers throughout April. It was last tested during a sharp drop on April 2, where a long wick suggested some buying interest. However, recent price action has shown indecision, with small-bodied candles forming near support.
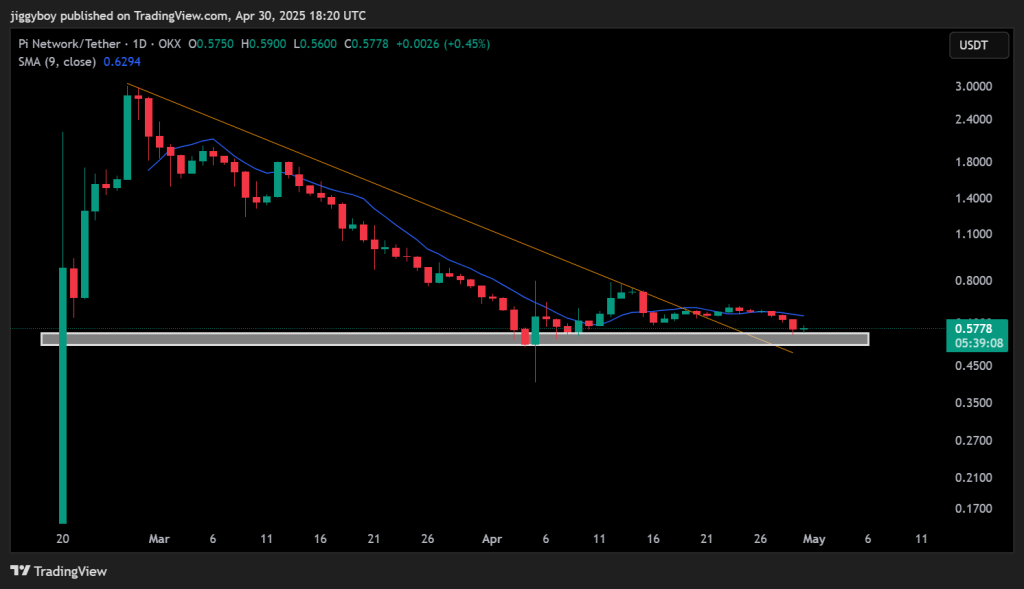
Moreover, the 9-day simple moving average, currently at $0.6294, continues to act as strong resistance. The Pi Coin price has remained below this line since mid-April, signaling ongoing bearish momentum. Above that, the next hurdle sits at $0.68–$0.70, a region that rejected previous recovery attempts.
Overall, Pi Coin remains inside a descending triangle structure, flat support with lower highs, often associated with bearish continuation unless broken to the upside.
Daily Technical Indicators
Most technical indicators continue to point toward weakness, with only one hinting at potential short-term relief.
| Indicator | Value | Interpretation |
| MACD (12,26) | -0.066 | Bearish momentum remains in place |
| CCI (14) | -212.7564 | Oversold conditions suggest possible bounce |
| Ultimate Oscillator | 43.341 | Weak buying strength |
| ROC (Rate of Change) | -4.757 | Downward momentum confirmed |
| Bull/Bear Power (13) | -0.0958 | Sellers are still in control |
The CCI reading in deep oversold territory is the only potential sign that a short-term bounce could occur, but other indicators remain aligned with a bearish trend.
Pi Coin Price Predictions for May 1
If Pi Network holds the $0.57 support zone, it could attempt to retest the $0.61–$0.63 area. A break above $0.63 can lead to a push towards $0.68, though this would likely have to be on firmer market support or rising volume.
Breakdown below $0.57 finds downside targets at $0.54 and $0.52. A clear break below $0.52 would affirm continued bearish pressure, with a possible fall to $0.45.
For now, the trend remains neutral to bearish. Traders should monitor whether Pi Coin price breaks above $0.63 or drops below $0.57 to determine the next direction. Broader market sentiment, especially Bitcoin’s performance, may influence whether Pi finds support or continues to slide.
Subscribe to our YouTube channel for daily crypto updates, market insights, and expert analysis.

We recommend eToro
Wide range of assets: cryptocurrencies alongside other investment products such as stocks and ETFs.
Copy trading: allows users to copy the trades of leading traders, for free.
User-friendly: eToro’s web-based platform and mobile app are user-friendly and easy to navigate.