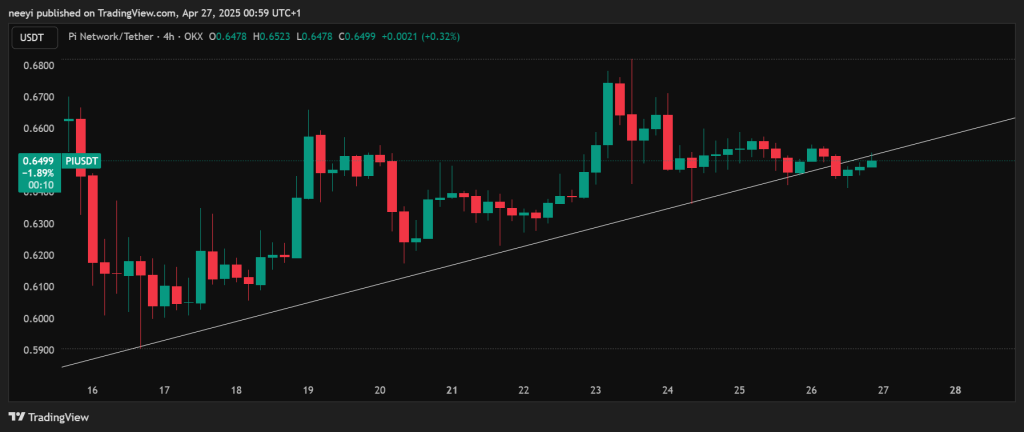
The price of Pi Coin (PI) has recently shown signs of weakness after weeks of sideways and downward price action. Since early April, the Pi Network price had been climbing slowly, respecting a clear ascending trendline on the 4-hour chart. Every dip along the way had been met with buying pressure.
However, things have changed. Yesterday, PI broke below that key ascending trendline. At the time of writing, the Pi price is trading around $0.6501, just under the former support line. The breakdown wasn’t extremely aggressive, but what matters is that a full 4-hour candle closed below the trendline and that is a clear bearish signal.
When an important trendline breaks on a higher timeframe like the 4-hour chart, it usually suggests that the market sentiment is shifting. Buyers are losing their grip, and sellers are slowly starting to take control.
If there is further selling pressure in the next few candles, the Pi coin could slide toward the next minor support zones between $0.62 and $0.60, and if the momentum continues, even lower levels could come into play. Unless Pi manages to quickly reclaim the broken trendline with strong bullish candles, today does not look promising for the token.
What you'll learn 👉
Current Indicator Readings for Pi Network Price
Looking at the PIUSDT chart data from Investing.com, the hourly indicators show mixed but leaning-bearish signals.
The Relative Strength Index (RSI) is currently at 51.993, which is neutral. RSI measures momentum, and a reading around 50 suggests that neither buyers nor sellers have a strong advantage yet. However, because we are just barely above the midline, it shows that the bullish momentum seen earlier has weakened.
The Stochastic Oscillator (STOCH 9,6) stands at 45.224, also indicating a neutral reading. Like the RSI, this tells us that Pi Coin is not currently in overbought or oversold territory, but it’s leaning closer to the middle, suggesting uncertainty.
The Commodity Channel Index (CCI 14) shows -28.6685, another neutral signal. This means there is no strong trend forming right now — buyers and sellers are still fighting for control after the trendline break.
Meanwhile, the Ultimate Oscillator gives a reading of 47.961 with a sell signal. This is a bearish sign because it combines different timeframes to measure momentum. A reading under 50 with a sell rating often confirms that the pressure is starting to shift to the downside.
Finally, the Rate of Change (ROC) indicator is at -1.701, signaling a sell. This negative ROC shows that the Pi price is losing value compared to previous periods, strengthening the bearish outlook.
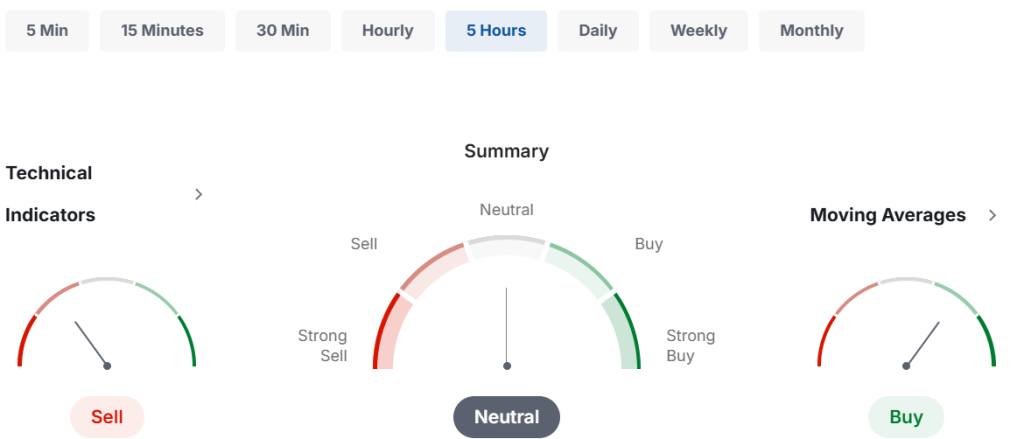
Moving Averages and Their Implications for Pi Price
When it comes to moving averages, which often act as dynamic support and resistance levels, the situation is somewhat split but still worrisome.
- The 50-period MA sits at $0.6383 (Buy) and $0.6443 (Buy), suggesting that on shorter-term movements, the Pi price is trying to stay supported above these averages.
- The 100-period MA at $0.6406 (Buy) and $0.6776 (Sell) shows that there’s slight support on the lower side, but resistance is not far above either.
- The 200-period MA is much higher at $0.7640 (Sell) and $0.8213 (Sell), confirming that longer-term momentum is still bearish, and the Pi Network price has a lot of work to do to recover.
Read Also: The Real Reasons BlackRock Is Avoiding an XRP ETF: Expert Insights
Pi Coin Price Prediction for Today (April 27)
Taking all the factors into account: the trendline breakdown, mixed but increasingly bearish indicators, and the moving averages situation, today’s outlook for Pi Coin leans bearish.
The most likely scenario for today is that Pi price will either consolidate slightly below the broken trendline or drift lower toward the minor support area around $0.62–$0.60. If buyers fail to step in soon, further downward pressure could build. On the flip side, if a sudden spike in volume pushes the price back above the broken trendline (which now acts as resistance), Pi might attempt to stabilize around $0.65–$0.66.
For now though, the path of least resistance seems downward.
Subscribe to our YouTube channel for daily crypto updates, market insights, and expert analysis.

We recommend eToro
Wide range of assets: cryptocurrencies alongside other investment products such as stocks and ETFs.
Copy trading: allows users to copy the trades of leading traders, for free.
User-friendly: eToro’s web-based platform and mobile app are user-friendly and easy to navigate.