Dogecoin might be setting up for a solid midterm move, at least according to a chart shared by prominent analyst World Of Charts on X. The analysis shows that DOGE price has finally broken out above a long-standing descending trendline and is now in the middle of a retest, a classic pattern that often comes before a fresh rally.
In the post, World Of Charts mentioned that the breakout has already happened and that DOGE is now retesting that breakout zone. They also hinted that a “massive bullish wave” could be on the horizon, backed by the chart’s projection of a possible 27% price jump if the setup plays out as expected. Traders are now watching closely to see if support holds and momentum picks up.
What you'll learn 👉
Dogecoin Breakout Pattern Indicates Change in Market Structure
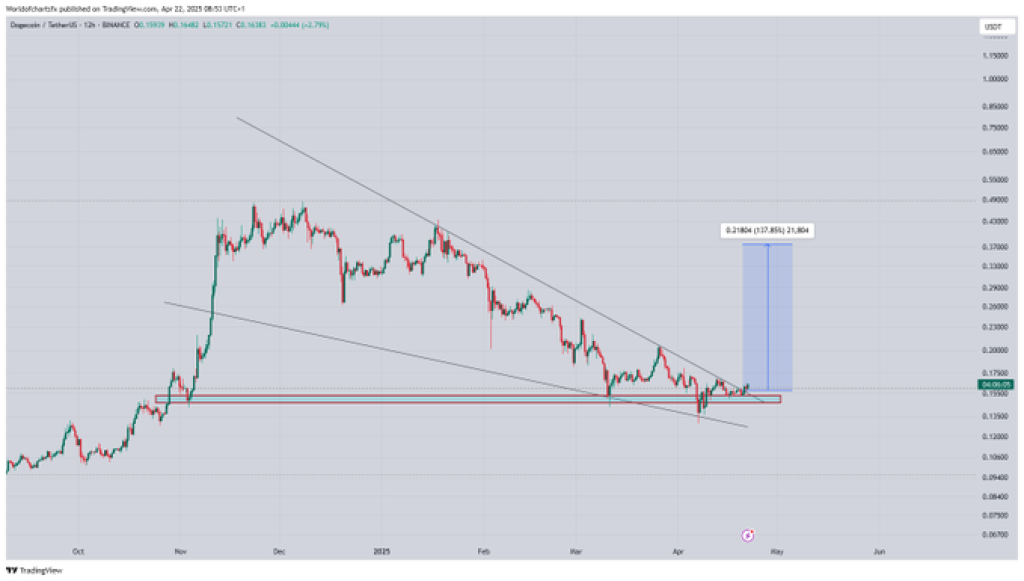
The DOGE daily chart displays a classic falling wedge pattern, a structure often linked with trend reversals. The pattern formed over several months, with the upper boundary acting as resistance and the lower boundary as support. The Dogecoin price has now broken out above the wedge’s upper boundary, shifting market sentiment from bearish to potentially bullish.
This technical breakout is accompanied by a pullback, a common pattern seen when assets retest their new support zone before moving higher. At present, DOGE is hovering near the $0.160–$0.165 area. This level, which served as resistance throughout the wedge formation, is now being tested as support.
DOGE Price Support and Resistance Zones Remain in Focus
The key support level appears to be centered around the $0.155–$0.160 range. This zone has held firm during previous attempts to push the price lower, reinforcing its role as a high-demand area. If buyers maintain control at this level, price continuation toward the upside remains a possible outcome.
To the upside, the projected target lies in the $0.22–$0.24 range. This area aligns with past resistance levels and also corresponds to the measured move derived from the height of the wedge. The chart shared by World Of Charts includes a visual indicator pointing toward this potential price level, estimating a 27.63% upside.
Read Also: Mantra’s CEO Keeps His Word – Massive Tokens Burned: Will $OM Price Go From Collapse to Catalyst?
Tweet Commentary Aligns with Technical Readings
The statement from World Of Charts reinforces what the technical indicators show. The mention of a “massive bullish wave” refers to the potential continuation phase that often follows a confirmed breakout and successful retest. Traders who follow this methodology are now watching for bullish confirmation signals such as strong volume or a reversal candle at the current support area.
The tweet and chart together form a cohesive analysis. They suggest a structured market setup, not speculative hype. Traders now await further action for DOGE price to determine whether the bullish scenario will unfold in the coming days.
Subscribe to our YouTube channel for daily crypto updates, market insights, and expert analysis.

We recommend eToro
Wide range of assets: cryptocurrencies alongside other investment products such as stocks and ETFs.
Copy trading: allows users to copy the trades of leading traders, for free.
User-friendly: eToro’s web-based platform and mobile app are user-friendly and easy to navigate.