
Cardano (ADA) is back in the spotlight after breaking out of a chart pattern it’s been stuck in for weeks. According to crypto expert Ali, ADA is finally making a move after a long stretch of sideways action. He pointed it out on April 21, 2025, just as the price started pushing past a key resistance line.
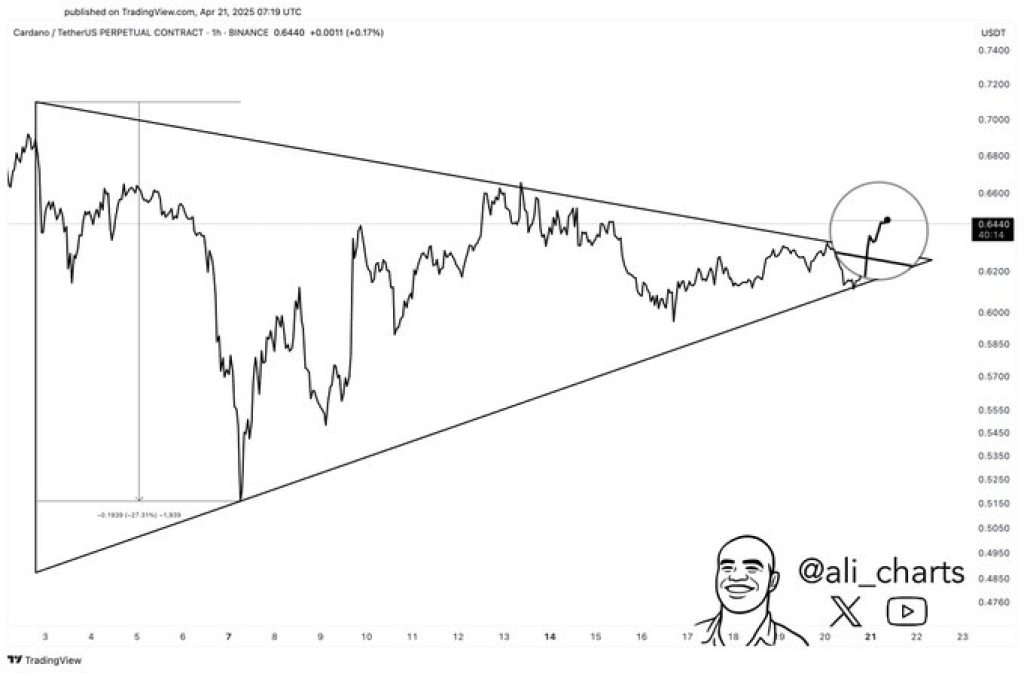
The chart he shared shows a classic symmetrical triangle, a setup that usually hints at a big move once price escapes the pattern. At the time of his tweet, ADA price had just broken above the upper trendline and was trading around $0.6440, signaling that momentum might be shifting in the bulls’ favor. At writing, ADA trades at $0.6474.
What you'll learn 👉
Symmetrical Triangle Breakout Observed on ADA Price Chart
The Cardano hourly chart shows a consolidation phase that began after a sharp decline from around $0.72 to $0.48. Over time, the asset formed higher lows and lower highs, compressing into a symmetrical triangle. These formations typically precede directional movement, and in this instance, the breakout occurred to the upside.
The apex of the triangle aligns closely with the breakout date, suggesting technical precision. The breakout was accompanied by a bullish candlestick that surpassed the triangle’s upper boundary near $0.6350. ADA Price action indicates strength, with the market testing the $0.6400 level shortly after exiting the pattern.
Cardano Price Key Support and Resistance Levels
After breaking out, ADA found support around $0.62, with the triangle’s upper trendline now working as new support between $0.635 and $0.64. These areas will help determine if ADA price can keep moving up in the next few trading sessions.
The next resistance is between $0.68 and $0.70, where ADA hit highs while still in the triangle. If it pushes past this range, it could head toward $0.72, which is where the previous downtrend started.
Will Cardano Price See a Trend Reversal Soon?
Before the breakout, ADA price was in a downtrend. The consolidation that followed created conditions for a shift in direction. The price is breaking out and showing upward momentum. Traders are watching to see if it will keep going up or drop back to test the breakout area.
Right now, the chart looks good for more upward movement, as long as we see strong volume and the price holds above the breakout point.
Read Also: Can Kaspa Price Hit $10? Here’s What the Numbers Actually Say
Subscribe to our YouTube channel for daily crypto updates, market insights, and expert analysis.

We recommend eToro
Wide range of assets: cryptocurrencies alongside other investment products such as stocks and ETFs.
Copy trading: allows users to copy the trades of leading traders, for free.
User-friendly: eToro’s web-based platform and mobile app are user-friendly and easy to navigate.