The XCN price is absolutely a top crypto gainer today with over 60% pump. Onyxcoin surged to over $0.022 before settling at the current price around $0.020.
Local lows of around $0.0075 served as a floor for this pump. As a reminder, the XCN price did 18x in January and hit $0.040 and it’s not that far away from this level now.
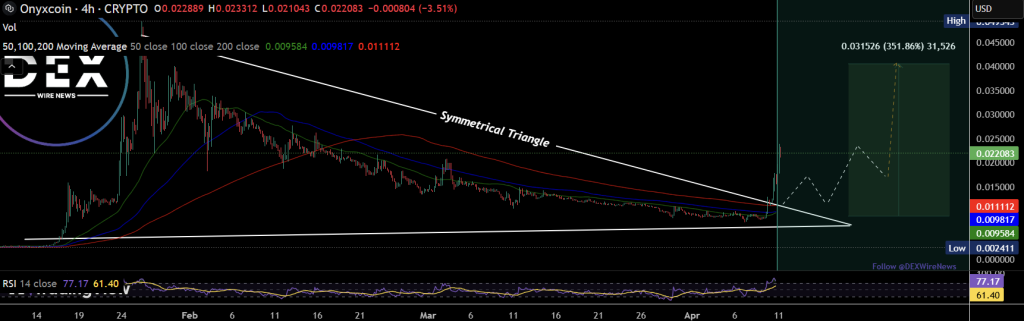
DEX Wire News posted an interesting XCN chart and analysis on TradingView.
What you'll learn 👉
XCN Chart: Powerful Breakout from Symmetrical Triangle
The 4-hour chart for Onyxcoin shows a clear bullish breakout from a symmetrical triangle pattern that formed over several months. This kind of pattern typically signals a strong continuation or reversal of trend once price breaks through.
The Onyxcoin price delivered exactly that with a massive breakout candle, jumping nearly 80% in a single move as it decisively broke through the upper resistance line. The projected target sits at $0.031526 which is a potential 351% increase from the breakout zone. This target aligns with a previous high around $0.040, giving the move technical support from historical price levels.
What makes this surge particularly interesting is that it happened while Bitcoin fell below $80,000 and Ethereum dropped toward $1,500. XCN managed to outperform in a red market – typically a strong signal of independent momentum.
XCN Price: Technical Indicators Support the Rally
The XCN price action has blasted through multiple moving averages, including the 50, 100, and 200 MA lines. This kind of movement typically confirms a shift from bearish to bullish market structure. While these moving averages are still pointing downward, a continued upward move will likely trigger a bullish crossover soon.
The RSI currently sits at 77.17, putting it in overbought territory. This means XCN might cool down or consolidate in the short term before making another leg up. However, during strong breakout phases, an overbought RSI can remain elevated for days as momentum continues to fuel the rally.
The chart projection suggests we might see some consolidation or a retest in the $0.015-$0.02 range before potentially moving toward the $0.0315+ target. This would follow a textbook post-breakout behavior pattern of rising, consolidating, then continuing upward.
What makes this movement huge is the combination of a classic technical breakout confirmed by a massive volume spike and strong trader conviction. Onyx’s focus on Web3 financial infrastructure may be attracting utility-driven demand, while the token’s ability to rise when major cryptos are falling signals potential unique catalysts.
Read also: Onyxcoin (XCN) Price Prediction: Is a 110x Rally Still Possible? Analyst Weighs In
Subscribe to our YouTube channel for daily crypto updates, market insights, and expert analysis.

We recommend eToro
Wide range of assets: cryptocurrencies alongside other investment products such as stocks and ETFs.
Copy trading: allows users to copy the trades of leading traders, for free.
User-friendly: eToro’s web-based platform and mobile app are user-friendly and easy to navigate.