Onyxcoin price saw a surge in January. This spiked XCN token by close to 2,000% before entering a period of steady decline. Over the past few weeks, the token has retraced more than 70% from its peak.
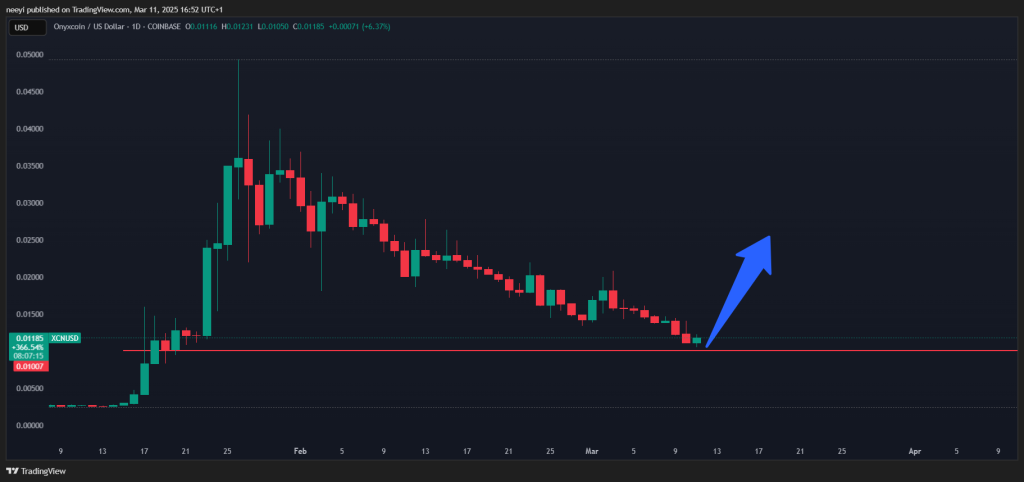
A closer examination of the XCN chart on the daily timeframe reveals that the token is approaching a key support level. This key level is around $0.01007. The point represents a crucial zone where buying pressure could potentially overcome selling pressure. Such could trigger a rebound.
What you'll learn 👉
Technical Analysis and Key Levels
The $0.01007 support coincides closely with the 0.786 Fibonacci retracement level. This makes the level an area of interest for traders. Fibonacci retracement levels often serve as important psychological barriers in cryptocurrency markets.
Should XCN successfully bounce from this support, traders should watch for resistance at several key Fibonacci levels. The 0.618 level at $0.01994 would likely present the first obstacle, followed by the 0.5 level at $0.02551.
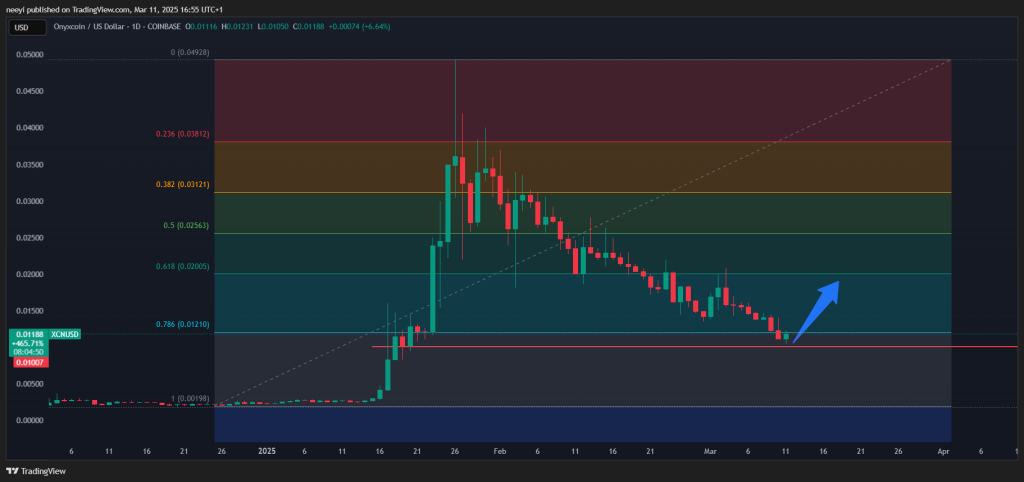
More significant resistance could emerge at the 0.382 level ($0.03107) and the 0.236 level ($0.03796), potentially slowing or halting upward momentum.
Market Dependencies and Bitcoin Influence
Bitcoin price action and broader market sentiment will undoubtedly influence Onyxcoin price trajectory in the coming weeks. A positive shift in the crypto market could provide the needed push for XCN to stage a meaningful recovery from its current levels.
Conversely, if market sentiment remains low, XCN price might enter a period of sideways consolidation. This will be a big test of patience for investors hoping for a quick rebound.
XCN Downside Risk Scenario
The most concerning scenario for XCN holders would be a break below the $0.01007 support level. If this critical support fails to hold, Onyxcoin could experience another substantial decline, potentially falling to around $0.00276—the price level observed before January’s rally began.
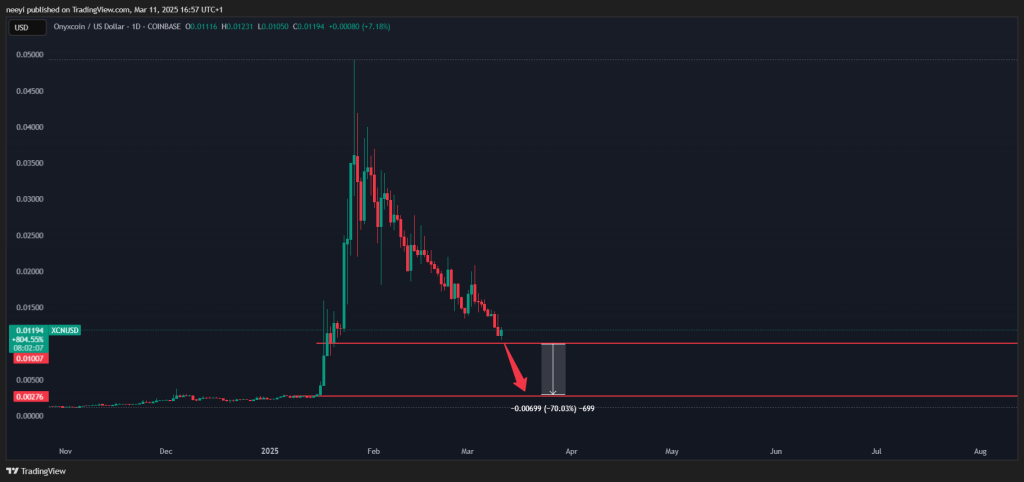
Such a move would represent approximately another 70% drop from the current key support level, effectively erasing all gains made during the January surge.
What to Watch
Investors should closely monitor price action around the $0.01007 support level. A strong bounce with increasing volume could signal a potential reversal. On the other hand, a breakdown with high volume might confirm further downside.
Read Also: How Much Could 500 Pi Coins Be Worth in 2026?
Watch for resistance at the key Fibonacci levels if a rebound happens. Pay close attention to the levels around $0.01994 and $0.02551, as these may prove challenging to overcome.
Remember that Bitcoin performance will likely dictate the broader market direction, making it an essential indicator for XCN’s future price movement as well.
Subscribe to our YouTube channel for daily crypto updates, market insights, and expert analysis.

We recommend eToro
Wide range of assets: cryptocurrencies alongside other investment products such as stocks and ETFs.
Copy trading: allows users to copy the trades of leading traders, for free.
User-friendly: eToro’s web-based platform and mobile app are user-friendly and easy to navigate.