The price of Litecoin just broke out of its range after 110 days, and traders are worried it might drop more. The breakout confirms the bearish trend, with traders watching key levels to guess where the price heads next.
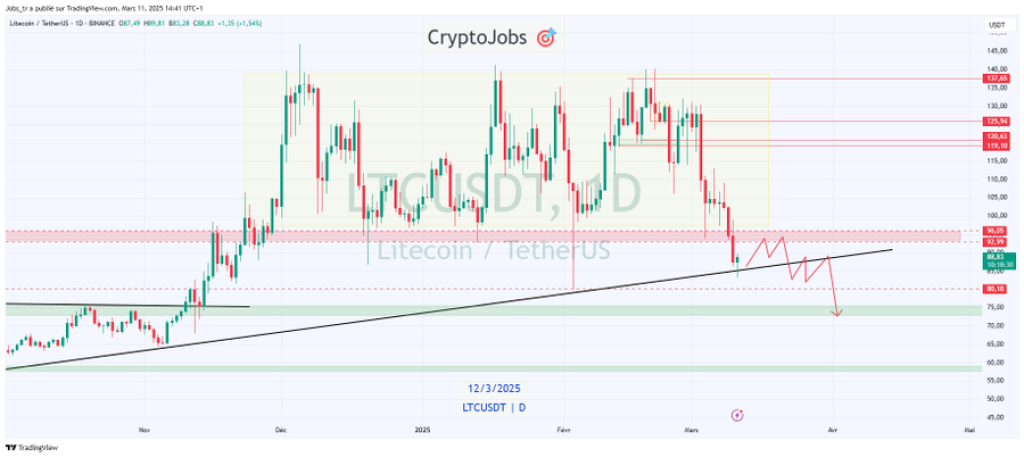
Prominent analyst CryptoJobs shared insights on X (formerly Twitter), highlighting the price breakdown and the increased selling pressure. The last daily close showed a bearish breakout. Litecoin now faces resistance around $95-$98, with potential drops to $80, $75-$73, $68, or even $63.
What you'll learn 👉
LTC Breaks 110-Day Range, Signaling Bearish Momentum
This price movement suggests a trend change after a long consolidation phase. Both daily and weekly charts show downward momentum, with technical indicators pointing to more selling.
On the daily chart, previous support levels now work as resistance. The range breakdown hints the bearish trend might continue, with $98-$100 now being important resistance. If the price of Litecoin can’t get back above this level, it could keep falling toward $80 and lower.
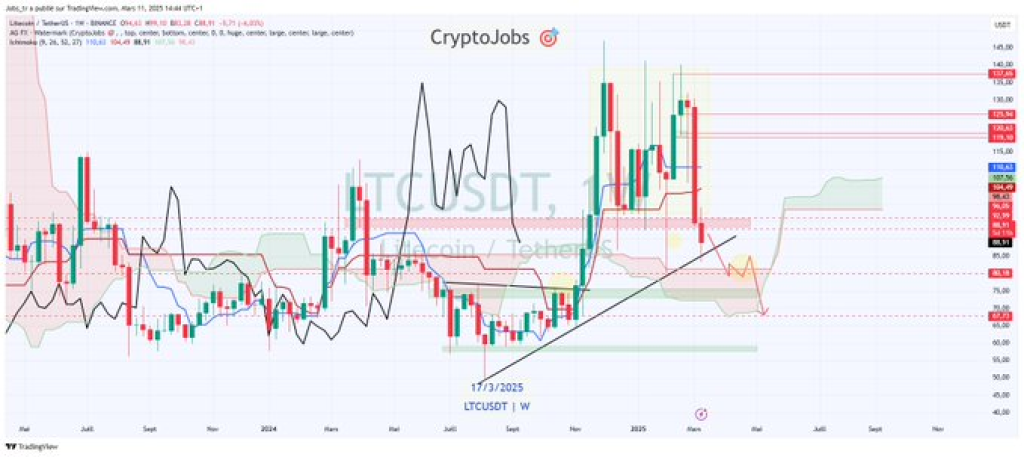
The weekly chart shows the Ichimoku Cloud support at $68 is important, with many traders expecting a test of this level soon. The breakdown of the multi-month uptrend adds to the bearish outlook.
Litecoin Resistance Retest Possible Before Further Decline
Despite the prevailing bearish outlook, LTC’s price might bounce back briefly before continuing down. The 1-hour chart analysis suggests a potential retest of the $95-$98 resistance range, which was previously a strong support zone. If price action confirms rejection at this level, Litecoin could face renewed selling pressure.

CryptoJobs3’s tweet highlights that monitoring the lower timeframes (H4-H1) is essential for traders looking to assess potential shorting opportunities. The tweet also suggests that unless Litecoin closes above $99 on the daily timeframe, the bearish outlook remains valid.
Read Also: Polkadot Price Analysis: This DOT Pattern Signals a Potential Reversal – Here’s the Outlook
LTC Key Support Levels to Watch
If the bearish trend continues, Litecoin could test several support levels soon. Based on historical price movements and technical indicators, traders are closely watching:
- $80: The next key support level
- $75-$73: A potential demand zone
- $68: Weekly Ichimoku Cloud support
- $63: The lower target if selling pressure persists
While short-term rebounds are possible, the overall trend remains bearish. A daily close above $99 would indicate a potential shift, but until then, traders remain cautious about further downside movement.
Litecoin’s price action continues to attract attention as traders evaluate whether the 110-day range breakout will lead to a prolonged downtrend or if support levels will hold.
Subscribe to our YouTube channel for daily crypto updates, market insights, and expert analysis.

We recommend eToro
Wide range of assets: cryptocurrencies alongside other investment products such as stocks and ETFs.
Copy trading: allows users to copy the trades of leading traders, for free.
User-friendly: eToro’s web-based platform and mobile app are user-friendly and easy to navigate.