Kaspa is struggling as the crypto market hits a rough patch. Bitcoin’s slide has pulled altcoins down with it, including KAS which shows concerning downward signals.
Technical charts aren’t painting a pretty picture, suggesting more drops might be ahead. Key support levels could determine if a reversal is possible or if the price will continue to slide.
What you'll learn 👉
Kaspa Price Action & Trend Analysis
KAS has taken a beating lately, dropping over 9% as of this writing and nearly 29% this week. Currently sitting at just under $0.076, the bearish trend is clear as the classic lower highs and lows that signal a downtrend are evident.
The $0.075 support level is critical right now, coinciding with the lower Bollinger Band. If KAS wants to recover, it’ll need to overcome tough resistance at $0.10 and the $0.12-$0.14 zone. If selling continues, watch for the $0.065-$0.070 range. A breakdown there could send prices below $0.06.
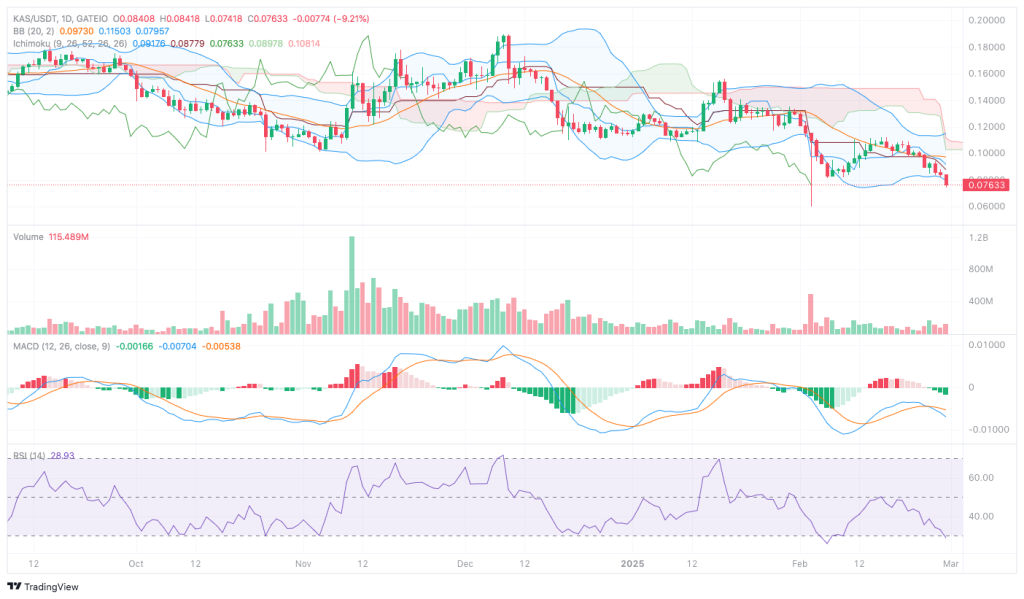
Meanwhile, the widening Bollinger Bands suggest increasing volatility, with the price hovering near the lower band at around $0.080 – typically a sign of strong downward momentum. The middle band, representing the 20-day simple moving average, stands at $0.09730, a critical level KAS must reclaim to reverse sentiment.
Breaking below the Ichimoku Cloud isn’t a good sign either. The Ichimoku Cloud confirms the bearish trend, with KAS trading well below the cloud. The red cloud ahead suggests stronger resistance soon.
The Kijun-Sen (baseline) at $0.10814 and Tenkan-Sen (conversion line) at $0.08779 indicate that recovery efforts face stiff resistance. The Chikou Span remains below the price action, further supporting the bearish sentiment.
Read also: Will Jupiter (JUP) Price Break Resistance Amidst Incoming Buybacks?
KAS Volume & Momentum Indicators
Volume analysis suggests that sellers dominate the market. A sharp increase in trading volume during the recent decline highlights strong selling pressure. A notable red volume bar signals that bears remain in control.
Momentum indicators offer little optimism for bulls. The MACD line sits at -0.00166, below the signal line at -0.00538, confirming the bearish trend. While the histogram shows slight improvement, no clear reversal signs have emerged.
KAS is deep in oversold territory with an RSI at 28.93, which typically signals a bounce is due. That said, strong downtrends can keep assets oversold for longer than you’d expect before any real recovery happens.
The bearish momentum remains strong across the board, but there are a few things to watch for if you’re looking for signs of life: the RSI climbing back above 30 and any bullish divergence on the MACD would be first indicators. For something more concrete, keep an eye on the $0.085 level near the Tenkan-Sen line – clearing that hurdle would suggest a potential recovery might be forming.
If sellers remain in control, expect a test of the $0.065-$0.070 support zone. Should that fail to hold, sub-$0.060 prices become likely, which could trigger another wave of selling.
Follow us on X (Twitter), CoinMarketCap and Binance Square for more daily crypto updates.
Get all our future calls by joining our FREE Telegram group.

We recommend eToro
Wide range of assets: cryptocurrencies alongside other investment products such as stocks and ETFs.
Copy trading: allows users to copy the trades of leading traders, for free.
User-friendly: eToro’s web-based platform and mobile app are user-friendly and easy to navigate.