
Bittensor (TAO) token has reached a critical support level that could signal the beginning of a significant price movement. After analyzing the weekly candlestick chart, we identified some key indicators suggesting TAO price might be preparing for its next bullish phase.
The TAO/USDT pair is currently testing a strong ascending trendline support that has been forming over the past seven months. As we observed, this trendline has repeatedly served as a reliable foundation for upward price movements. The recent price action shows a wick extending down to approximately $250, indicating substantial buying interest at this level.
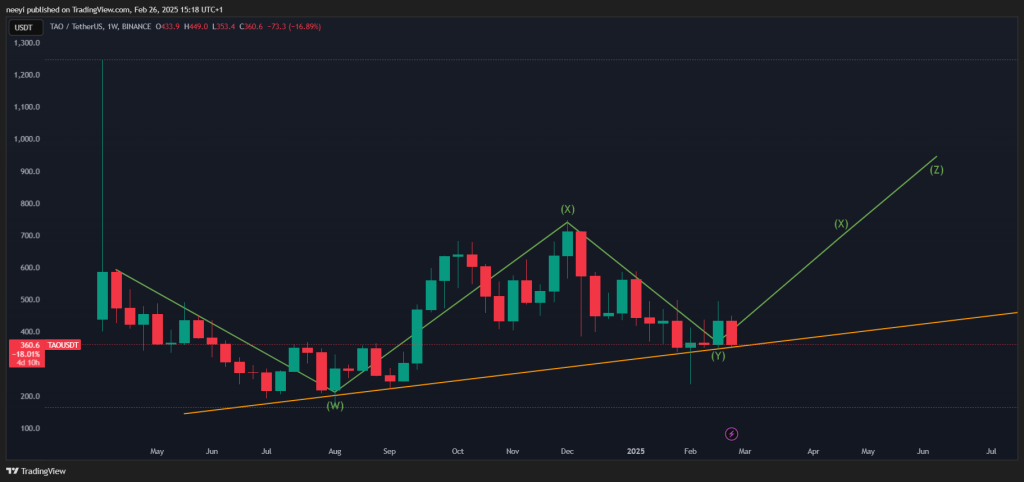
Looking at the chart structure, TAO appears to be forming what technical analysts call a complex corrective WXYXZ pattern. In the analysis, the last Y wave has found strong support precisely at this trendline, which typically signals that a new upward leg could be imminent. If this pattern continues to develop as expected, the projected Z wave would likely result in a powerful bullish breakout.
One of the recent weekly candle closed with a pronounced lower wick, suggesting that buyers are actively defending this support zone. In my view, if the next weekly candle establishes a higher low, we would have compelling confirmation of a potential trend reversal.
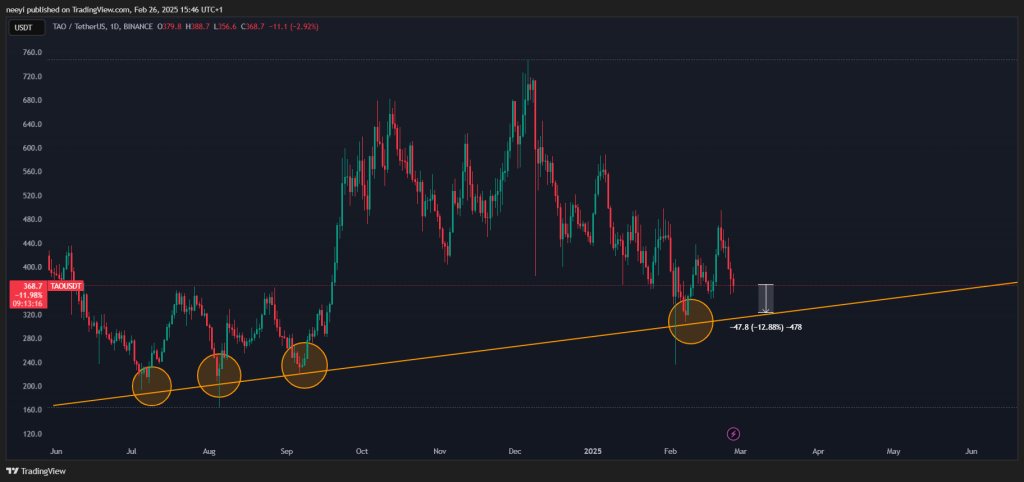
The trendline support appears stronger when viewed from the daily chart, which reflects multiple bounces from that level. However, the daily chart also shows that there is room for some more declines before the leg up starts at the trendline.
Potential Price Target for Bittensor (TAO) Price
For traders following TAO, there are key resistance levels to monitor. We have identified the $500-$600 range as a mid-range resistance area where previous supply zones existed. Should the bullish pattern play out as anticipated, the $800-$1000 zone represents a reasonable take-profit target.
Read Also: Is Celestia (TIA) Price Ready for a Massive Comeback? These Charts Suggest a Reversal!
If TAO breaks below the support trendline we have identified, we could witness a deeper correction toward the $250 zone. However, as long as the price maintains its position above the ascending trendline, the bullish scenario remains the most probable outcome.
Subscribe to our YouTube channel for daily crypto updates, market insights, and expert analysis.

We recommend eToro
Wide range of assets: cryptocurrencies alongside other investment products such as stocks and ETFs.
Copy trading: allows users to copy the trades of leading traders, for free.
User-friendly: eToro’s web-based platform and mobile app are user-friendly and easy to navigate.