Indicator Signals ‘Buy’ for Chainlink (LINK) as Key Metrics Turn Bullish: Here’s the Outlook

Chainlink price action is showing signs of a potential reversal. This was revealed in a post by Ali, a popular crypto analyst on X. The analyst sees some signals on the TD Sequential indicator that suggest it is time to buy the LINK token.
Chainlink experienced a sharp decline over the past several days, with several bearish candles indicating strong selling pressure. However, with this signal changing, LINK may be preparing for a bounce.
The TD Sequential indicator has printed a buy signal on the daily timeframe, marked by the number “9” with an upward arrow. In technical analysis, this signal often suggests trend exhaustion and frequently precedes a reversal or at least a short-term recovery. As Ali points out in his analysis, these signals can be particularly meaningful after extended downtrends.
#Chainlink $LINK appears ready for a rebound as the TD Sequential indicator flashes a buy signal on the daily chart! pic.twitter.com/SabLzw9QGA
— Ali (@ali_charts) February 26, 2025
Candlestick Formation Also Suggests LINK Reversal Is Imminent
The circled green candlestick on the chart represents a potential price reversal or short-term bounce at a key support level. This formation deserves special attention from traders watching LINK next move.
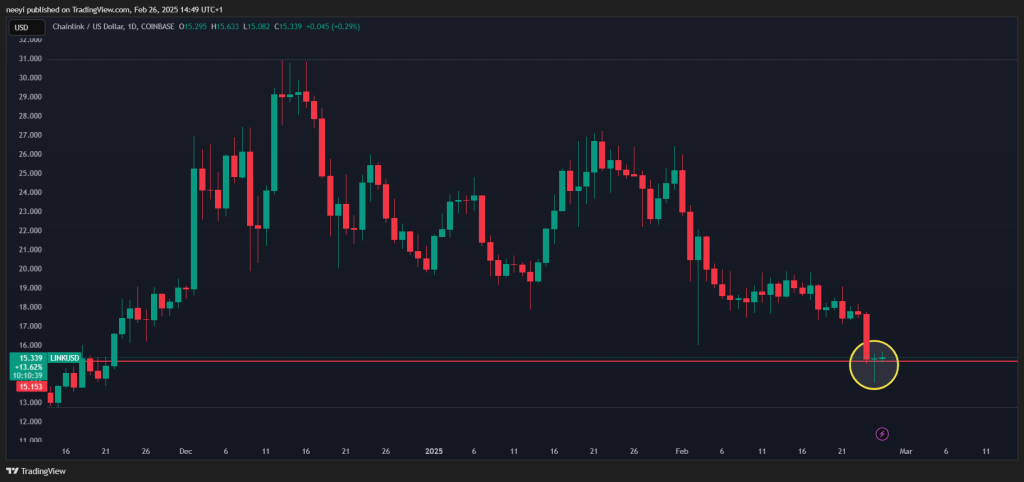
The candlestick forms at a previously established support level of approximately $15.15. This indicates that buyers have stepped in to defend this price zone.
The candlestick has a pronounced lower wick. It indicates price rejection at lower levels. This suggests that sellers initially pushed the price down but buyers regained control. The buyers were able to push the price higher before the close – a bullish signal in the context of the recent downtrend.
The green pattern coming after a strong red bearish candlestick suggests a possible reversal or temporary relief from the downtrend. If followed by additional green candles with increasing volume, this could mark the beginning of a meaningful recovery for LINK price.
Read Also: JasmyCoin (JASMY) Flashes Bullish Signal as Expert Eyes ‘Aggressive’ Price Recovery
Two scenarios appear possible from here. First is a bullish case where the next few candles continue to close higher with increased volume, potentially marking the start of a recovery. On the other hand, a bearish continuation is possible if the price fails to break above the resistance formed by recent lows.
If buyers continue to accumulate at these levels, we might see LINK move toward previous resistance levels around $16.50 – $17.00. However, traders should wait for confirmation in the form of a strong bullish candle closing above resistance before establishing long positions.
Subscribe to our YouTube channel for daily crypto updates, market insights, and expert analysis.

We recommend eToro
Wide range of assets: cryptocurrencies alongside other investment products such as stocks and ETFs.
Copy trading: allows users to copy the trades of leading traders, for free.
User-friendly: eToro’s web-based platform and mobile app are user-friendly and easy to navigate.