Kaspa holders can be fairly happy with how this week is going, considering that the KAS price recovered well from the dip and pumped 26% in the last 7 days. Only today, Kaspa is up 9%, now trading above the $0.10 level.
The main catalyst behind the recent price surge is the announcement that Coinbase Advanced is adding support for Kaspa perpetual futures. The trading platform will open KASPA-PERP markets on or after 9:30 am UTC on February 20, 2025, alongside SPX-PERP.
Coinbase Advanced is adding support for $KASPA and $SPX perpetual futures.
— Coinbase Traders (@coinbasetraders) February 13, 2025
The opening of KASPA-PERP and SPX-PERP markets will begin on or after 9:30 am UTC 20 FEB 2025. pic.twitter.com/uN4VJKvXRL
What you'll learn 👉
Kaspa Chart: Technical Analysis
We took a look at the KAS/USDT chart to see where Kaspa price could be headed next. The chart shows a well-defined descending channel, indicating that KAS has been in a downtrend for some time. The price recently bounced sharply from the bottom of this channel, suggesting buyers are stepping in, though we’d need to see a break above the channel’s upper boundary for a confirmed trend reversal.
A significant detail to note is that the 200-day moving average sits above the current price, reinforcing the overall bearish sentiment. Typically, when price trades below this key indicator, it’s considered to be in a downtrend, with the 200-day MA often acting as resistance.
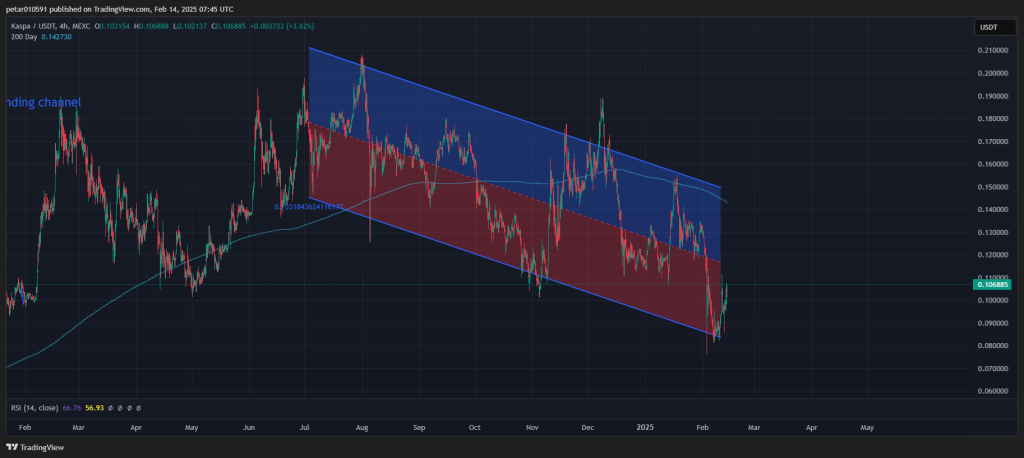
The KAS price found strong support in the $0.09-$0.10 range, where buyers stepped in to prevent further decline. Key resistance levels include the channel’s mid-line and the 200-day MA around $0.14. Despite the recent bounce, it’s worth noting that Kaspa remains in a broader downtrend, with lower highs and lower lows still forming.
Looking at momentum indicators, the RSI shows readings of 66.76 and 56.93, suggesting that Kaspa is neither overbought nor oversold at current levels. If the RSI pushes above 70, it could signal overbought conditions and a potential pullback. Conversely, an RSI below 30 might indicate oversold conditions and a possible bounce.
Read also: Time to Buy Kaspa (KAS) During the Dip? 4 Altcoins To Invest In Instead
Kaspa Price Prediction
In a bullish scenario, if Kaspa breaks out of the descending channel and surpasses the 200-day MA (~$0.14) with strong volume, we could see a trend reversal. This could lead to targets of $0.12-$0.13 at the channel’s midline, followed by $0.14-$0.15 near the 200-day MA, and potentially $0.17-$0.18 if momentum continues.
If the price remains inside the descending channel, we might see consolidation between $0.10-$0.12. A break above $0.12 could signal an attempt to shift momentum toward bullish, while failure to break this level could keep KAS inside the channel, prolonging the downtrend.
In a bearish case, if Kaspa fails to break resistance ($0.12-$0.14) and falls back, it could retest support at $0.10, followed by the $0.09-$0.095 zone. A breakdown below $0.09 would suggest a continuation of the long-term downtrend, potentially leading to $0.08 or lower. This scenario becomes more likely if we see a failed breakout at $0.12-$0.14, followed by rejection and lower RSI readings.
Subscribe to our YouTube channel for daily crypto updates, market insights, and expert analysis.

We recommend eToro
Wide range of assets: cryptocurrencies alongside other investment products such as stocks and ETFs.
Copy trading: allows users to copy the trades of leading traders, for free.
User-friendly: eToro’s web-based platform and mobile app are user-friendly and easy to navigate.