Some indicators are already pointing to a potential for continued decline in the price of BTC. This is coming after the price reached a new all-time high of around $109,000 three days ago. Since then, we have been seeing a slow but steady decline in the price of Bitcoin. But could this also be the start of the much-awaited alt season?
What you'll learn 👉
TD Sequential Signals a Potential Bitcoin Price Correction
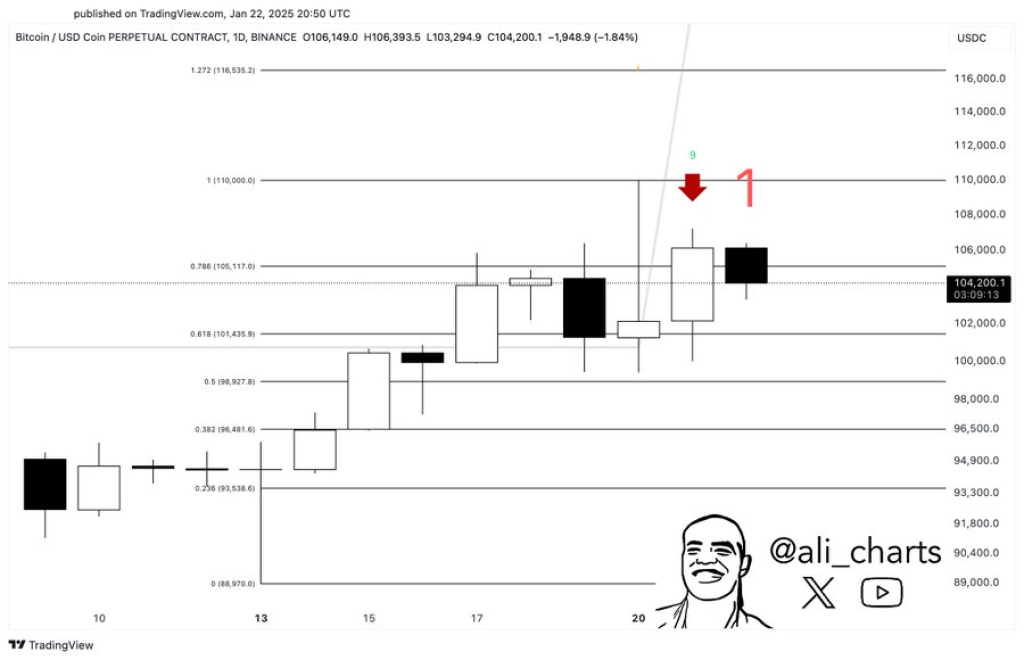
Trader Ali notes critical technical indicator on Bitcoin daily chart. The TD Sequential indicator has generated a sell signal, which could mark the end of Bitcoin’s recent upward momentum.
The chart reveals a technical analysis focusing on Fibonacci retracement levels and the TD Sequential indicator. At its current trading price of around $104,200, Bitcoin price appears to be hesitating near a significant resistance zone.

The sell signal, marked by a “9” in green, suggests the uptrend might be losing steam. Key Fibonacci levels provide additional context for potential price movements. The 0.786 level at approximately $105,117 aligns closely with the recent high, while the 0.618 level around $101,435 could serve as a potential support zone if a correction occurs.
Is Altcoin Season Coming Now?
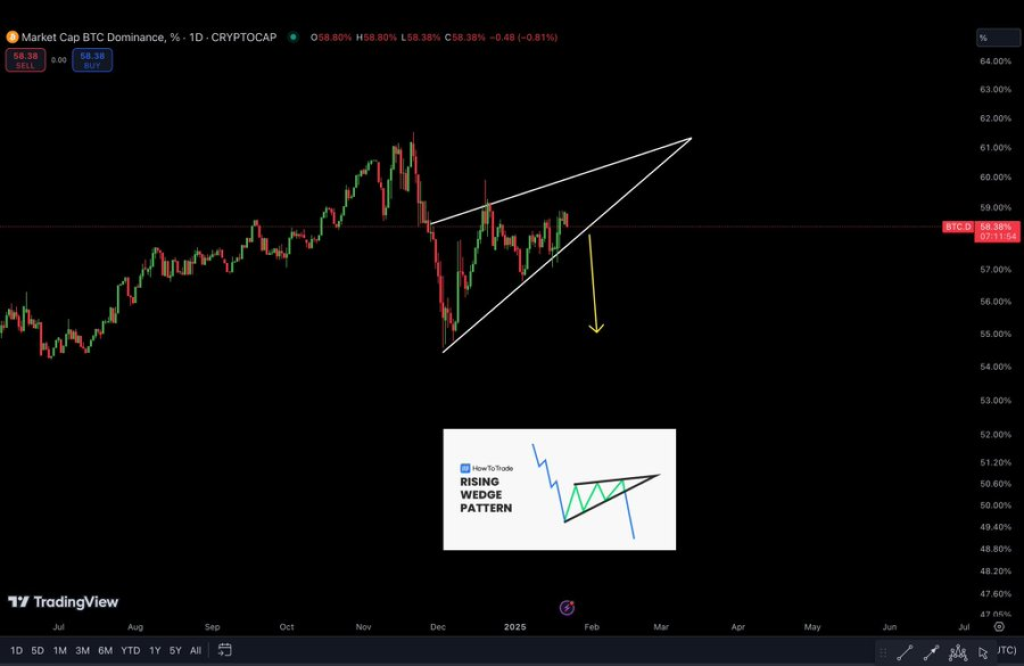
Another prominent crypto analyst, Ash Crypto, is pointing to an exciting possibility. The Bitcoin Dominance (BTC.D) chart is showing a bearish rising wedge pattern, which could signal an imminent shift in the cryptocurrency market dynamics.

A breakdown in Bitcoin market dominance could be the catalyst for what Ash calls “Altseason 2.0”. This phenomenon occurs when investor funds begin to flow from Bitcoin into alternative cryptocurrencies, potentially triggering significant rallies across the altcoin market.
The rising wedge pattern suggests that Bitcoin’s market capitalization percentage might be set to decline. For altcoin enthusiasts, this could mean an upcoming period of substantial opportunity and growth.
Read Also: How Much Will 1,000 Sonic Tokens Be Worth in 2025? Sonic (S) Price Prediction

What Traders Should Watch
Investors and traders should keep a close eye on two key technical indicators:
- The TD Sequential sell signal around the $105,000 resistance level
- The potential breakdown of Bitcoin’s dominance chart
If these technical indicators play out as suggested, we could be on the cusp of a major market shift. A confirmed move below the Bitcoin dominance wedge, accompanied by increasing trading volume, would further validate the bearish outlook for Bitcoin and the bullish potential for altcoins.
Subscribe to our YouTube channel for daily crypto updates, market insights, and expert analysis.
We recommend eToro
Wide range of assets: cryptocurrencies alongside other investment products such as stocks and ETFs.
Copy trading: allows users to copy the trades of leading traders, for free.
User-friendly: eToro’s web-based platform and mobile app are user-friendly and easy to navigate.


