OM’s price has shown strong movement over the past year, supported by notable trends and levels. The token began its rise early in the year and has since maintained an upward trajectory. With prices stabilizing near $4.00, traders are closely monitoring for potential breakthroughs or corrections.
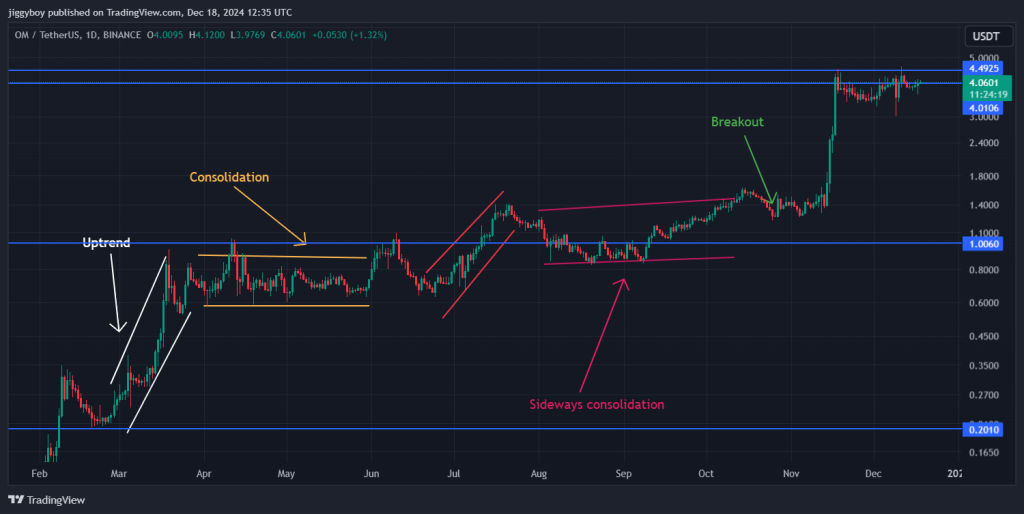
Mantra started its journey near $0.20 in March, where buyers gained control, pushing the price through key resistance levels. By April, OM reached $1.00 but entered a consolidation phase for the next two months, with the price moving sideways between $0.60 and $1.00.
The next bullish wave emerged in mid-June, driving the token to $1.60 before facing a correction. A pullback to levels below $1.20 set the stage for another recovery. By late October, OM’s price broke its $1.80 resistance, initiating a strong rally. This momentum carried the price sharply upward, reaching $4.50 in November. Following this spike, OM stabilized between $4.10 and $4.50, establishing a new support zone.
What you'll learn 👉
Support and Resistance Zones
The price chart highlights multiple key support and resistance levels. The long-term support zone lies between $0.20 and $0.35, which marked the starting point of the uptrend. A higher support range, between $1.00 and $1.20, became significant following OM’s retracement earlier this year.

Currently, OM is holding a support level at $4.00. Should prices remain above this zone, traders expect a challenge of the resistance range at $4.50 to $5.00. However, a drop below $4.00 could lead to a pullback toward $3.00.
Read Also: Why Ripple (XRP) Price Could Reach $10 This Bull Run
Price Patterns and Trends
The chart also shows a rising trendline connecting the lows from March, June, and October. This upward line signals a consistent bullish trend. A parabolic price spike occurred in November, reflecting strong momentum driven by significant buying activity.
Mantra is trading sideways between $4.00 and $4.50 right now. This might mean big players are quietly buying, or the market’s taking a breather before possibly pushing up to $5.00.
Furthermore, when OM shot up in November, we saw lots of trading activity – a good sign that buyers were stepping in. Since then, things have cooled off and the price has settled down. Market participants will closely watch for volume increases, which could indicate renewed upward movement. OM’s price still looks strong. Traders are keeping an eye on $4.00 as a floor and $4.50 as a ceiling to figure out where it heads next.
Subscribe to our YouTube channel for daily crypto updates, market insights, and expert analysis.
We recommend eToro
Wide range of assets: cryptocurrencies alongside other investment products such as stocks and ETFs.
Copy trading: allows users to copy the trades of leading traders, for free.
User-friendly: eToro’s web-based platform and mobile app are user-friendly and easy to navigate.


