Chainlink (LINK) price action and ecosystem developments have been of interest in the crypto market lately.
Per Michaël van de Poppe, an analyst with over 751k followers, LINK remains an “undervalued gem.” Sharing his insights on X, van de Poppe highlighted key developments, including strategic partnerships and notable purchases, that underline the asset’s potential.
In his tweet, he pointed out a $1 million purchase of LINK by Trump’s World Liberty Finance and a strategic collaboration with Emirates NBD. These factors, combined with LINK’s historical performance, signal promising developments for the token, currently trading around $28.47.
What you'll learn 👉
Chainlink’s Price Performance and Trends
LINK has moved beyond its accumulation phase of 2022-2023, entering a robust uptrend in 2024.
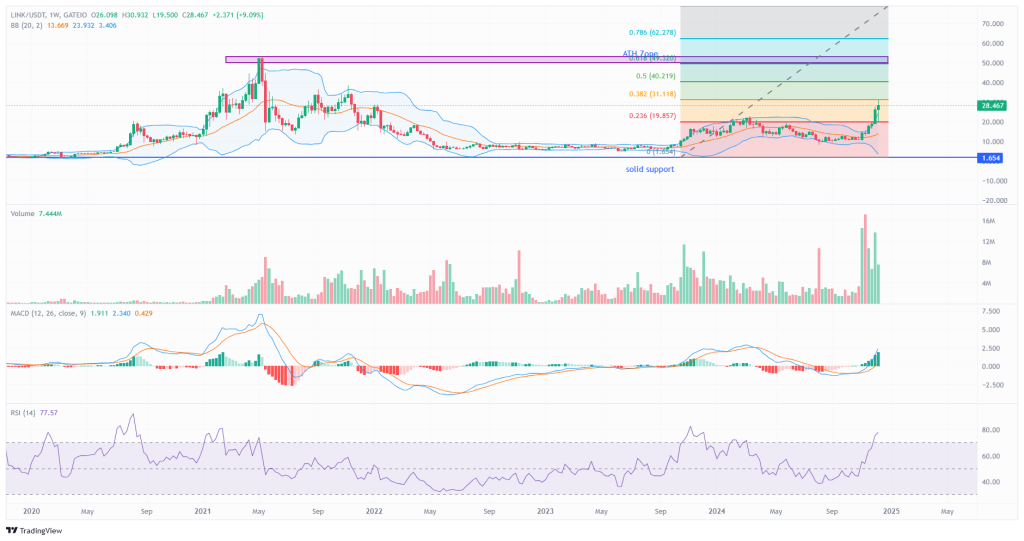
The token is showing consistent upward momentum, reinforced by market enthusiasm and strong technical indicators. It reached an ATH of $52.88 during the 2021 bull run. Current price action suggests it may soon approach or exceed this milestone.
On the weekly chart, LINK has surpassed the 0.236 Fibonacci retracement level at $19.85, suggesting the continuation of bullish momentum. The next resistance level lies at $31.11, with other critical thresholds at $40.22 and the ATH of $52.88. A Fibonacci extension sets a long-term price target of $62.28.

Key Support and Resistance Levels
Chainlink has several strong support zones that reinforce its current trajectory. Historical support at $1.65 served as the foundation for its ongoing rally. Intermediate support is observed near $19.85, a level that was recently breached and has now turned into a critical support zone.
Resistance levels are closely watched, particularly $31.11, where a breakout could propel LINK toward $40.22. Beyond this, $52.88, the ATH, remains a focal point for traders and investors. Should LINK surpass this level, the Fibonacci extension at $62.28 becomes the next target.
Read also: Why Is Avalanche (AVAX) Price Doubling? Key Chart Analysis Revealed
Indicators and Market Sentiment
Technical indicators reflect robust bullish momentum. LINK is trading above the upper Bollinger Band, a sign of potential overextension, though such moves often accompany strong upward trends. The MACD indicator also confirms bullish activity, with the histogram expanding and the lines sloping upward.
However, the RSI reading of 77.57 places LINK in overbought territory, signaling the possibility of short-term pullbacks or consolidations. Historical patterns suggest that even if corrections occur, they are often followed by a continuation of the upward trend.
Chainlink is benefiting from increasing market interest, notable partnerships, and positive price action. While technical indicators suggest strong momentum, traders remain cautious about potential pullbacks. Analysts, including van de Poppe, emphasize LINK’s long-term potential, highlighting its journey toward retesting and possibly exceeding previous highs.
Follow us on X (Twitter), CoinMarketCap and Binance Square for more daily crypto updates.
Get all our future calls by joining our FREE Telegram group.
We recommend eToro
Wide range of assets: cryptocurrencies alongside other investment products such as stocks and ETFs.
Copy trading: allows users to copy the trades of leading traders, for free.
User-friendly: eToro’s web-based platform and mobile app are user-friendly and easy to navigate.


