JASMY’s price shot up 14.25% today, making it one of the best performers in crypto. Trading picked up too, with volume up 41.31% over the last 24 hours.
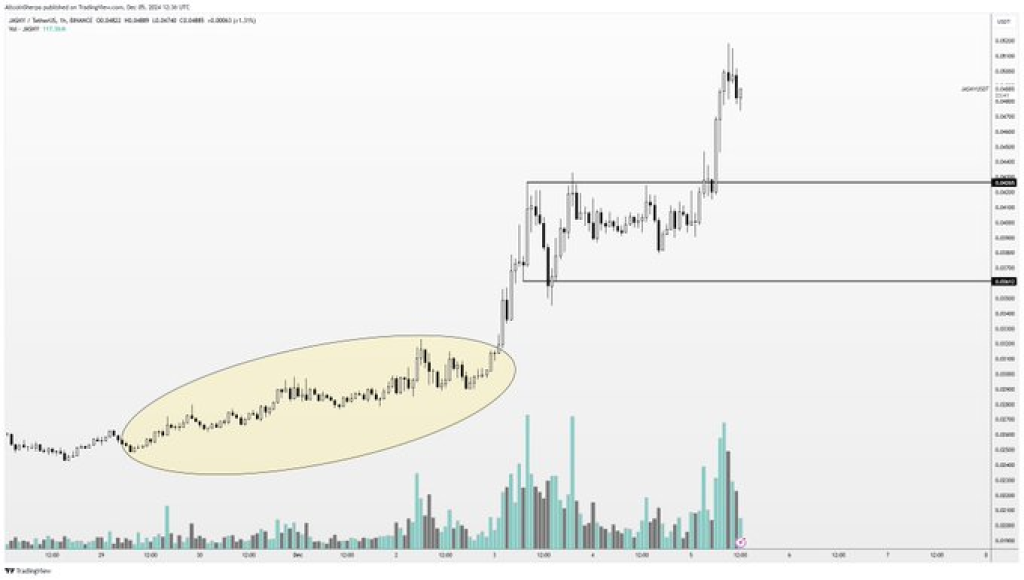
Crypto expert, Altcoin Sherpa revealed on X (formerly Twitter) two interesting patterns that helped push the price up. The token went through periods of sideways trading and showed a stair-like pattern in its price movements.
What you'll learn 👉
JasmyCoin Chart Analysis
The JASMY chart highlights a period of sideways movement, often referred to as “consolidation and chop.” This phase, characterized by stable price action within a narrow range, is seen in the earlier part of the chart. During this time, trading volume remains consistent, with slight increases toward the end of the consolidation zone.
Such periods are typically indicative of market participants accumulating positions in anticipation of a significant move. Once this base is established, prices often break out of the range, as seen in JASMY’s recent performance.
Following the consolidation phase, JASMY’s price displayed a clear TWAP (Time-Weighted Average Price) stair-step pattern, where the price moves upward in a series of well-defined steps.
Each step is marked by intermittent consolidation zones, followed by another upward push. This pattern is often a sign of sustained buying pressure, potentially driven by algorithmic trading systems or strong market demand.
Volume spikes during these upward movements further validate the strength of the breakouts. The increased volume suggests heightened investor interest, providing additional momentum to the bullish trend.

Key Support Levels and Volume Analysis
Two key support levels have emerged during JASMY’s price action. The first lies between $0.0036 and $0.0037, marking the initial consolidation zone after the breakout. The second is at $0.0041 to $0.0042, another zone of consolidation before the next upward leg. These levels may serve as potential pullback areas for traders monitoring the asset.
Volume analysis also supports the bullish trend, with higher trading volumes aligning with the breakout phases. This alignment indicates strong buyer conviction and validates the breakout patterns identified in the chart.
Read Also: Top Analyst Reveals Three Key Events Likely to Explode Ripple (XRP) Price
Insights from the Tweet and Market Trends
Altcoin Sherpa’s tweet emphasizes the two recurring patterns—consolidation and TWAP-stair price action—that have been observed across many low-cap assets on Binance. These patterns, as illustrated in JASMY’s price chart, often result in substantial upward movements, making them key indicators for traders.
JASMY’s recent surge has placed it in the spotlight, as both the price and trading volume gains reflect increased investor confidence. These developments position JasmyCoin as a notable player in today’s crypto market trends.
Subscribe to our YouTube channel for daily crypto updates, market insights, and expert analysis.
We recommend eToro
Wide range of assets: cryptocurrencies alongside other investment products such as stocks and ETFs.
Copy trading: allows users to copy the trades of leading traders, for free.
User-friendly: eToro’s web-based platform and mobile app are user-friendly and easy to navigate.


