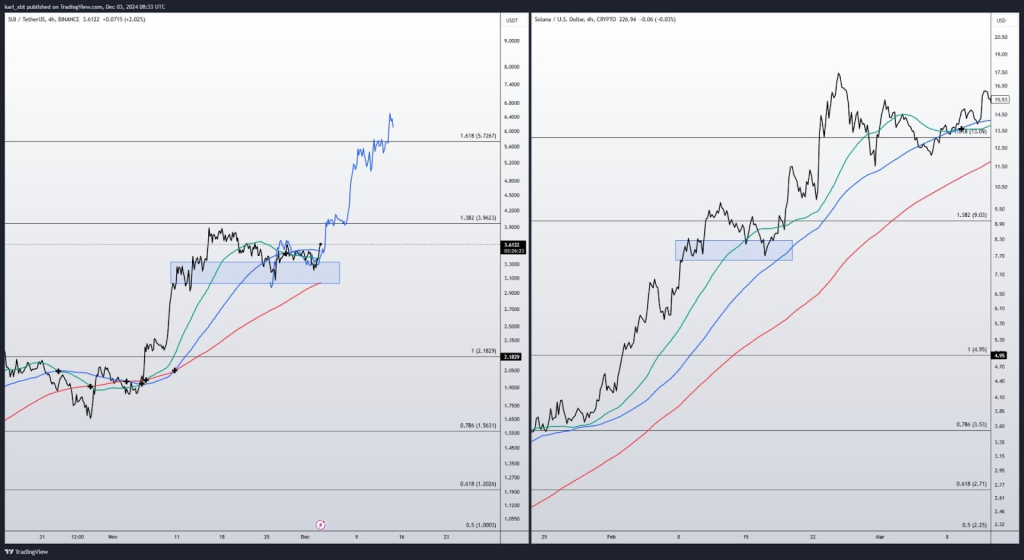
Crypto analyst Karl revealed some insights on X (formerly Twitter) about SUI’s potential for a substantial rally, with a projected target of $6. Karl describes the upcoming movement as the “next explosive leg,” aligning with technical analysis that suggests a strong continuation of SUI’s upward trend.
What you'll learn 👉
SUI Chart Analysis: Breakout and Fibonacci Projections
SUI’s price action on the 4-hour chart reveals a well-established uptrend, marked by consistent higher highs and higher lows. Recent consolidation around $3.0, highlighted by a blue rectangular zone, acted as a springboard for a breakout. The breakout positions $3.0 as a robust support level, encouraging further upward momentum.
Technical indicators support this bullish outlook. Fibonacci retracement levels are key tools in this analysis, with the 1.382 level at $3.96 serving as interim support and the 1.618 level at $5.767 as the next likely target.
Moving averages further affirm this trend, as short-term, medium-term, and long-term averages provide dynamic support to the price. Karl’s predictive line suggests the current rally could mirror the previous impulsive wave, increasing confidence in the $6 target.

Solana’s Historical Context: A Blueprint for SUI?
The analysis of Solana’s price movement provides valuable context for SUI’s potential trajectory. SOL’s earlier breakout from a consolidation zone at $8.30 mirrors SUI’s recent price action. Fibonacci projections for SOL successfully identified critical levels, including the 1.618 extension, which SOL tested during its rally.
This historical similarity strengthens the case for SUI’s continuation toward $6, as the two assets exhibit comparable technical patterns and momentum-driven rallies.
Read Also: Litecoin Price Breaks Key Resistance: Analyst Highlights LTC Pattern Pointing to $400 Price Target
Community Insights and Market Sentiment
Karl’s tweet has drawn attention from the crypto community, with many anticipating SUI’s price surge. Describing the next move as an “explosive leg,” the tweet underlines the parallels between SUI’s current trend and its prior performance. The mention of a predictive line based on previous rallies adds to the optimism among traders.
While SUI shows promising signs of following a bullish path, investors are monitoring support levels around $3.0 and resistance near $5.767. These critical zones will determine whether the token can achieve the $6 target projected by both Fibonacci levels and historical patterns observed in SOL.
SUI’s price movements, technical indicators, and comparisons to Solana suggest potential for a strong rally. Traders are focusing on maintaining support above $3.0 while preparing for resistance around $5.767. Karl’s analysis and historical trends indicate that momentum could propel SUI toward the $6 mark, solidifying its bullish trajectory.
Subscribe to our YouTube channel for daily crypto updates, market insights, and expert analysis.
We recommend eToro
Wide range of assets: cryptocurrencies alongside other investment products such as stocks and ETFs.
Copy trading: allows users to copy the trades of leading traders, for free.
User-friendly: eToro’s web-based platform and mobile app are user-friendly and easy to navigate.


