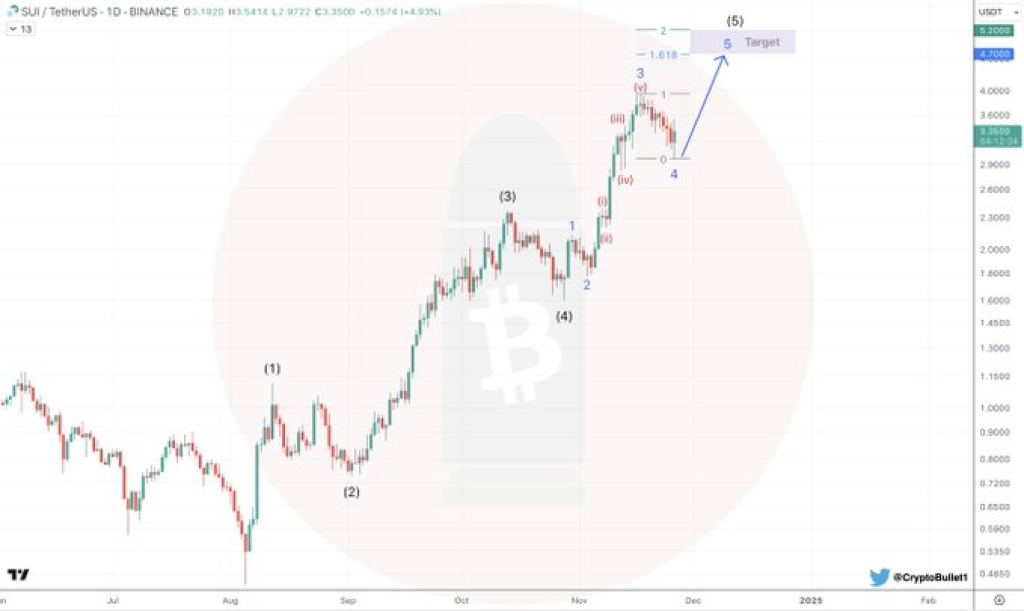
Top analyst CryptoBullet revealed on X (formerly Twitter) that SUI’s price chart of late indicates a bullish continuation following a brief correction. The prediction suggests the token could reach between $4.7 and $5.2, aligning with Elliott Wave (EW) theory projections. Traders are advised to monitor the developments closely as SUI approaches its next potential breakout.
What you'll learn 👉
SUI Technical Analysis: Elliott Wave Analysis and Price Projections
The chart shared by CryptoBullet applies EW theory, a popular technical analysis framework. This methodology identifies price movements in five distinct waves, alternating between impulsive and corrective phases. The current analysis suggests SUI’s price has completed Wave (4), a minor pullback, and is beginning Wave (5), an upward trend.
According to the chart, the Wave (5) target aligns with the 1.618 Fibonacci extension level, often used to project bullish momentum. The estimated resistance zone for this wave is between $4.7 and $5.2, where traders may expect increased selling pressure. Meanwhile, the support level is identified near $3.0, the previous low formed during Wave (4). A breakdown below this level could invalidate the bullish outlook.

Image Source: X/CryptoBullet
Healthy Pullback and Bullish Continuation
CryptoBullet’s tweet underscores the importance of the recent correction, describing it as a “healthy pullback” necessary to sustain upward momentum. Corrections like these are typical during Wave (4) phases, allowing the market to consolidate before a potential breakout.
The chart reveals a steady uptrend with higher highs and higher lows, reflecting strong buying interest. The momentum observed during Wave (3), often the most powerful wave in EW theory, adds further credibility to the bullish scenario for Wave (5).
Read Also: Fantom (FTM) Price Pumps: ‘There’s a Lot to Like,’ Says Elite Crypto Analyst
Support and Resistance Levels for Traders
Traders should keep a close eye on key levels highlighted in the analysis. The $3.0 zone serves as a critical support, providing a safety net for bullish traders. On the other hand, the $4.7–$5.2 range is a potential take-profit area, as the price may face resistance near these levels.
As SUI’s price continues its upward journey, the projected Wave (5) could provide an opportunity for traders to capitalize on the bullish momentum. However, monitoring price action and market signals will remain crucial to validate this prediction.
Subscribe to our YouTube channel for daily crypto updates, market insights, and expert analysis.
We recommend eToro
Wide range of assets: cryptocurrencies alongside other investment products such as stocks and ETFs.
Copy trading: allows users to copy the trades of leading traders, for free.
User-friendly: eToro’s web-based platform and mobile app are user-friendly and easy to navigate.


