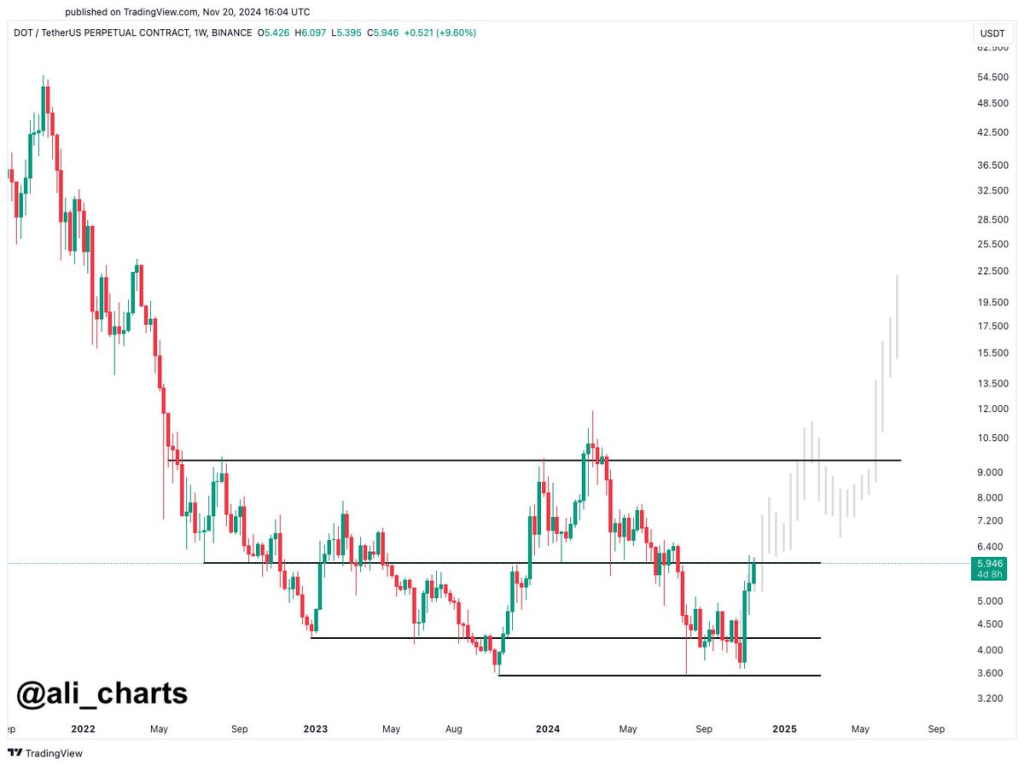
Polkadot (DOT) is gaining momentum as expert Ali Charts predicts a price spike to $11. Technical analysis supports this prognosis, which comes after DOT’s price action saw a noteworthy breakout.
Ali Charts’ tweet, “#Polkadot $DOT is going as planned! Next stop: $11!” aligns with the chart trends, offering insights into potential price movements.
What you'll learn 👉
DOT’s Price Movement and Resistance Levels
At $5.946, Polkadot is now trading at a strong 18.50% gain over the week. The price is currently breaking through a critical resistance zone of $6.40–$6.50 after being on a protracted downward trend from its top in 2022.

A confirmed breakout here could pave the way for further gains. Key historical resistance levels include $9.00 and the $11.00 target noted by Ali Charts.
The $11.00 mark holds psychological and technical significance, representing an 85% potential upside from the current price.
Support zones are identified at $4.50, which marked the base of the ongoing bullish move, and $3.20, the lowest level during DOT’s extended downtrend.
Reversal Patterns and Trends
Technical analysis reveals a potential reversal in DOT’s bearish trend. A double-bottom structure around $4.50 signals bullish momentum, with the current breakout suggesting increased buying pressure. Despite limited visibility of volume data, the 9.60% price increase underscores strong market demand.
This upward momentum aligns with Ali Charts’ forecast, which anticipates continued bullish performance. The absence of significant resistance between $6.50 and $9.00 suggests that the path toward the $11.00 target is viable, provided momentum remains strong.
Read also: This Meme Coin Trader Updates His Shiba Inu (SHIB) Price Prediction
Bullish and Bearish Scenarios
For DOT to achieve the predicted $11.00 price, a sustained breakout above $6.50 is necessary. This would likely propel the token toward $9.00, with further gains contingent on continued buying pressure.
Indicators such as strong daily closes above resistance and increasing volume would support this scenario.
However, failure to surpass $6.50 could trigger a pullback to $5.00 or $4.50, areas expected to provide support. A breakdown below $4.50 would negate the bullish outlook, resuming the prior downtrend.
Follow us on X (Twitter), CoinMarketCap and Binance Square for more daily crypto updates.
Get all our future calls by joining our FREE Telegram group.
We recommend eToro
Wide range of assets: cryptocurrencies alongside other investment products such as stocks and ETFs.
Copy trading: allows users to copy the trades of leading traders, for free.
User-friendly: eToro’s web-based platform and mobile app are user-friendly and easy to navigate.


