The price of Mantra (OM) has been testing a major resistance level multiple times in recent days, sparking speculation among traders about a potential breakout.
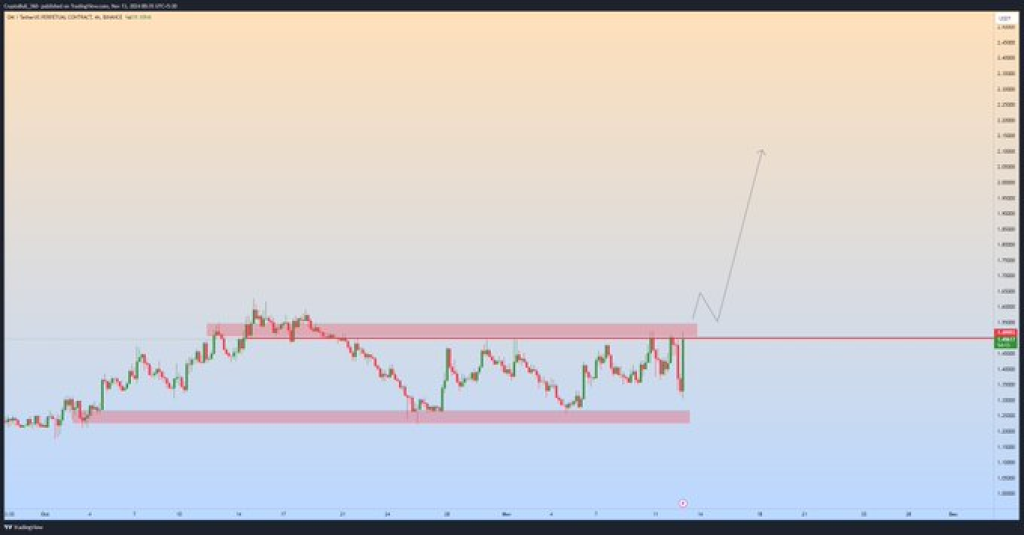
Prominent analyst CryptoBull_360 shared on X that if OM successfully flips this resistance zone, it could trigger a “volatile bullish rally.” The chart shared in the tweet displays a range-bound pattern, where the price fluctuates between well-defined support and resistance zones.
With each test of the resistance level, anticipation grows as the market awaits a potential breakout that could push the OM price to new highs.
What you'll learn 👉
Mantra (OM) Price Testing Resistance and Support Zones
In the current trading environment, OM’s price action is characterized by a sideways range between two key zones. The resistance area is illustrated between 1.5-1.6 level with the price level which the market has struggled to break beyond due to resistance.
There is a selling response every time the price moves even a little higher than this point suggesting active selling at this level. In the opposite direction, the support zone is established between 1.2-1.3 levels where some buyers are present, and therefore, declines cannot be witnessed further and the price serves to be stable.
There is always a period of inactivity followed by extreme momentum – this is the build-up phase. If the resistance zone is broken, we consider it as a bullish trend however if it gets breached then further consolidation is expected between these levels.
Mantra (OM) Chart Analysis: The Range-Bound Market and Potential Breakout
The chart analysis reveals a rectangle pattern, typical in a range-bound market, where the price oscillates between established support and resistance zones. In this scenario, a break above or below the rectangle could determine the direction of the trend.
The tweet emphasizes that a “strong flip off from the resistance zone” could act as a launchpad for a sustained upward move. Traders and investors are watching closely, as a breakout could signify a trend reversal with increased trading volumes.

CryptoBull_360’s tweet highlights that OM has been testing its resistance zone consistently, indicating a buildup of pressure. With each test, the resistance level weakens, increasing the possibility of a breakout.
This tweet suggests that the market sentiment is becoming increasingly bullish, with traders keeping a close watch for a potential surge in buying activity.
A successful flip of the resistance into a support zone would signal strong buyer interest, potentially leading to a rally. This sentiment aligns with the upward arrow depicted in the chart, pointing to a possible bullish breakout if the resistance level is breached.
Read Also: Why is Peanut The Squirrel (PNUT) Price Pumping?
What Lies Ahead for OM?
While no specific price target is outlined in the chart, the potential for a breakout suggests a significant upward movement. Should OM’s price breach the resistance zone and establish it as new support, it may enter a new trading range, targeting higher price levels. The anticipation around this move has created a buzz among traders who are looking for signs of confirmation in the form of a breakout and retest.
As OM continues to test these levels, traders are advised to monitor the price closely. A breakout above the resistance zone could trigger a rally, potentially transforming the current consolidation phase into a bullish trend.
Subscribe to our YouTube channel for daily crypto updates, market insights, and expert analysis.
We recommend eToro
Wide range of assets: cryptocurrencies alongside other investment products such as stocks and ETFs.
Copy trading: allows users to copy the trades of leading traders, for free.
User-friendly: eToro’s web-based platform and mobile app are user-friendly and easy to navigate.


