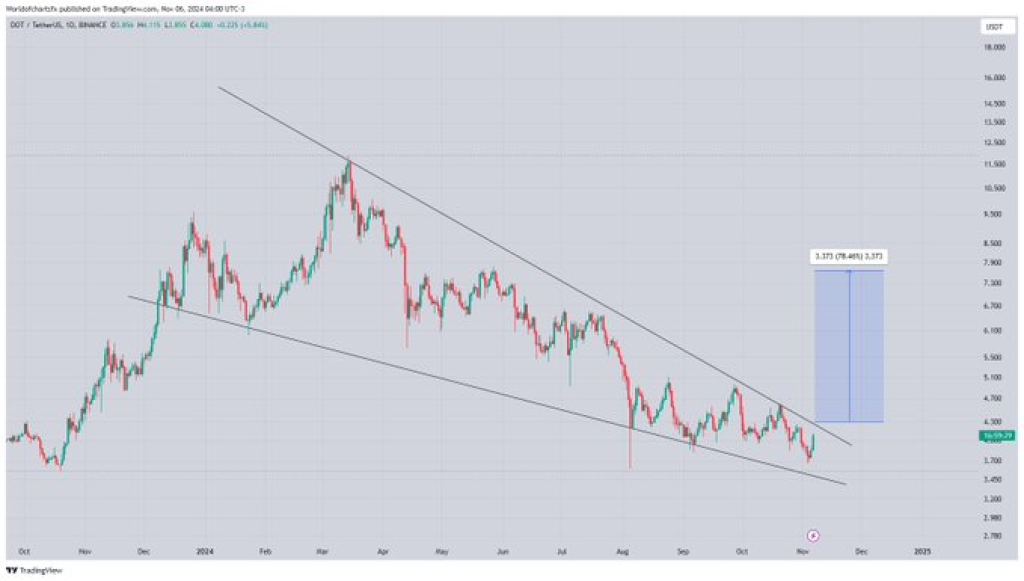
Popular analyst World of Charts shared on X (formerly Twitte) that Polkadot (DOT) price is showing strong signs of consolidation within a “Falling Wedge” pattern.
DOT may move closer to a target of $10 if it can successfully break out of this pattern, which is frequently observed prior to a bullish trend reversal. The current chart pattern and price movement of DOT point to increasing pressure for an upward trend.
What you'll learn 👉
Polkadot Chart Analysis: Falling Wedge Pattern Hints at Reversal
The chart highlights DOT’s price movement within a falling wedge, characterized by two converging trendlines. The upper trendline acts as resistance, with several unsuccessful attempts by DOT to break above it.
This resistance line, descending in alignment with lower highs, signals that sellers have maintained control, but the tightening pattern indicates potential bullish momentum. Meanwhile, the lower trendline acts as support, where buyers have consistently defended the price, preventing further declines.
This pattern suggests that DOT is in the final stages of consolidation, with price pressure building up. Historically, falling wedge patterns are often associated with bullish breakouts, hinting at a possible price surge once DOT breaks above the upper trendline.

Support and Resistance Levels Indicate Key Zones
The analysis identifies two critical areas for DOT’s price: the support zone at the lower boundary of the wedge and the resistance zone at the upper boundary. The support line has proven resilient as buyers step in to sustain the price, signaling strong demand.
If DOT breaks the upper trendline, this resistance area could transform into a base for further upward movement. A breakout would likely gain momentum if accompanied by a substantial increase in trading volume, reinforcing the bullish outlook.
Tweet Signals Optimism for Polkadot’s Rally
World Of Charts’ tweet underscores optimism surrounding Polkadot’s potential, expressing anticipation for a breakout that could lead to a robust recovery. The analyst suggests a price target of $10 for DOT, a level that aligns with the falling wedge projection on the chart.
The tweet describes this pattern as a “tight consolidation range,” hinting that a breakout could be imminent as DOT nears the end of the wedge formation.
Read Also: Meme Coin Whales Massively Accumulate PEPE as Price Pumps
Could DOT Price Reach $10?
Based on the height of the falling wedge, the projected target for a successful breakout is around $10, approximately 79.48% higher than DOT’s current level. This ambitious target reflects the potential bullish sentiment among traders and aligns with the technical analysis presented by World of Charts.
Finally, if DOT can break above the wedge’s resistance and maintain upward momentum, the cryptocurrency may reach this price level, marking a substantial gain.
Subscribe to our YouTube channel for daily crypto updates, market insights, and expert analysis.
We recommend eToro
Wide range of assets: cryptocurrencies alongside other investment products such as stocks and ETFs.
Copy trading: allows users to copy the trades of leading traders, for free.
User-friendly: eToro’s web-based platform and mobile app are user-friendly and easy to navigate.


