Rekt Capital, one of the leading technical crypto analysts, has shared his latest price outlook on Solana and Injective in his recent newsletter.
What you'll learn 👉
Solana’s Critical Resistance Level Under Test
The blue diagonal trendline resistance has been a significant barrier for Solana over the past several months. While SOL has repeatedly tested this level with upside wicks beyond the diagonal line, it consistently failed to maintain these gains, resulting in Weekly Closes below the resistance.
The SOL price managed to secure a Weekly Close above the blue diagonal resistance, technically suggesting a potential breakout scenario. However, the subsequent price action has seen SOL retrace significantly, dropping below the blue diagonal trendline.
The market now faces a crucial question: Is this current retrace merely a volatile retest of the confluent resistance area marked by the blue diagonal trendline and red box region, or was the previous Weekly Close above this zone a false breakout?
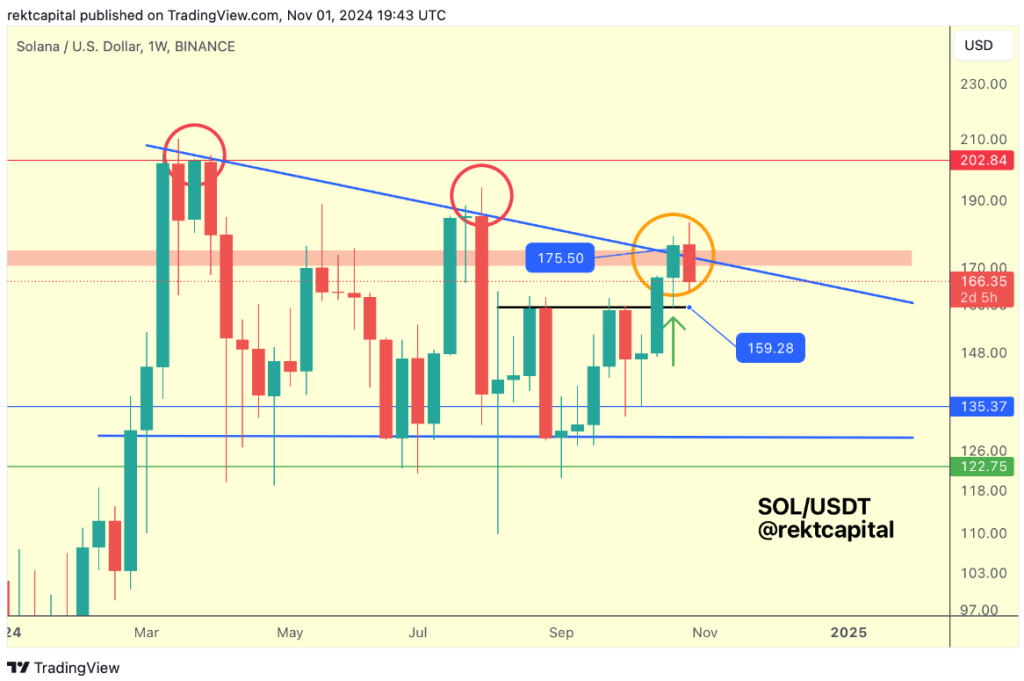
The weekend’s price action will likely provide clarity. A Weekly Close above the blue diagonal and red area would confirm a volatile retest, while a close at current levels could trigger a pullback to the $159 support level.
SOL is currently trading around $166, showing a modest decline of 1.2% for the day.
Read also: Analyst on Why Kaspa’s (KAS) Price Action Shouldn’t Worry Holders
Injective’s RSI Signals and Range Analysis
INJ has been consolidating within its established orange-orange range, with recent price action pulling back to the Range Low at $18.02. However, a crucial technical indicator suggests the potential for further downside movement.
The Relative Strength Index (RSI) has historically served as a reliable indicator for INJ’s local bottoms. Previous instances of the RSI touching the Higher Low level have consistently preceded local bottoms or upward price reversals. Currently, the RSI remains notably distant from this Higher Low target.
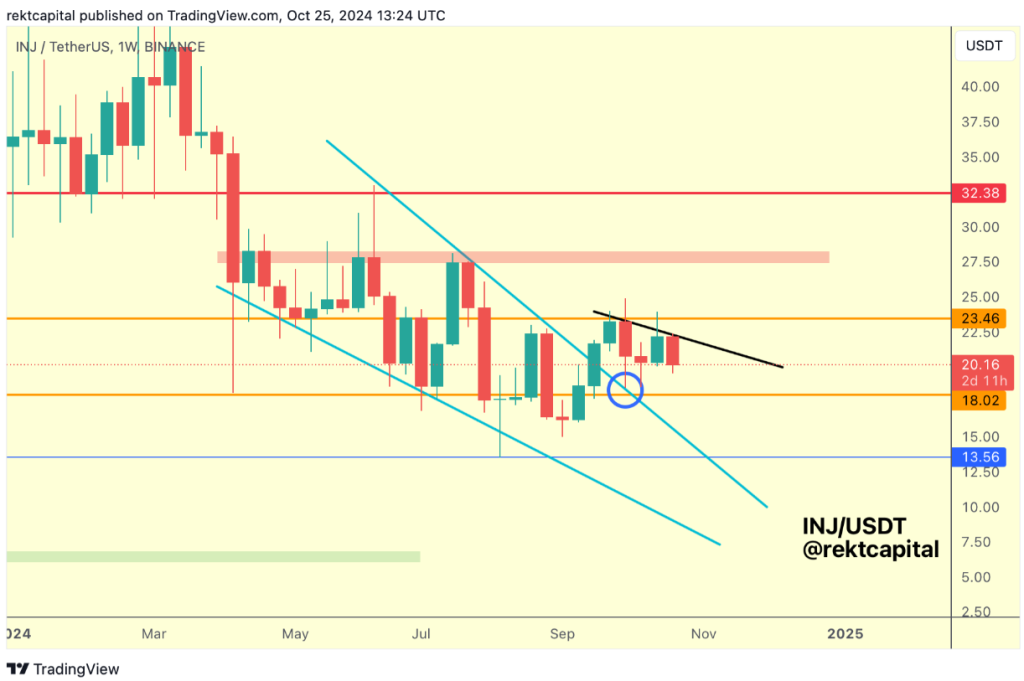
For the INJ price to maintain its current range, the price needs to secure a Weekly Close above the Range Low of $18.02. If INJ can sustain stability above this level while the RSI approaches the Higher Low, it might avoid further downside pressure. However, a Weekly Close below the Range Low could transform this level into resistance and potentially trigger additional decline until the RSI Higher Low is reached.
INJ is currently trading at approximately $18.51, down 2.8% on the day.
Subscribe to our YouTube channel for daily crypto updates, market insights, and expert analysis.
We recommend eToro
Wide range of assets: cryptocurrencies alongside other investment products such as stocks and ETFs.
Copy trading: allows users to copy the trades of leading traders, for free.
User-friendly: eToro’s web-based platform and mobile app are user-friendly and easy to navigate.


